
Categories
Blog Data Analytics

Data Quality Management: Framework, Metrics & Best Practices

Almost every organisation now carries a second version of itself inside its systems. A retailer reads demand through stock movement. A hospital depends on patient records. A bank studies transaction history. A marketing team follows campaign performance, customer behaviour, and audience segments.

When that data starts carrying gaps, duplicates, or old details, the effect shows up quickly. Reports become less reliable, forecasts lose direction, and teams make decisions with more doubt than they should.

Data quality management stops that drift. It gives organisations a disciplined way to keep data accurate, consistent, traceable, and usable across daily operations.

Data Quality Management for Decisions That Can Stand Scrutiny

Data quality management is the operating discipline used to define, measure, monitor, improve, and protect data across its lifecycle.

In practice, it brings together profiling, validation, cleansing, metadata, lineage, stewardship, exception handling, and review cycles. A mature programme also sets acceptable thresholds, identifies critical data elements, assigns stewards, and defines what happens when quality drops below an agreed standard.

Simply put, data quality management prevents poor records from becoming accepted business truth. It protects campaign segments, revenue figures, and operational records from carrying hidden errors forward.

Strong data quality also depends on governance, because standards need authority before they can hold across teams. Quality checks then show whether those standards are working in practice.

Why Data Quality Is Important for Brands

Why is data quality important?

Because every brand experience is now shaped by information that customers rarely see.

A customer receives the same offer twice because two profiles exist in the CRM. A loyal buyer is excluded from a premium campaign because the purchase history was not updated. A sales team follows dead leads because the source data was never cleaned. A finance team delays reporting because revenue figures differ across systems.

These issues may start in systems, but they are felt in cost, speed, service, and customer perception.

The benefits of data quality management become visible when teams stop treating data correction as part of everyday work. Marketing targets with greater precision. Sales pipelines become easier to read. Finance closes with fewer reconciliation issues. Leadership works from a shared version of performance.

A Data Quality Framework Built for Real Operations

A data quality framework sets a clear process for judging data quality and correcting issues before they affect reports or decisions.

A useful framework should cover five areas.

1. Critical Data Identification

Start with the data that carries business weight.  Customer records, transaction history, product data, consent fields, campaign performance, supplier records, and financial figures usually need priority.

These are the records where one wrong value can affect revenue, compliance, service, or reporting.

2. Business Rules and Quality Standards

Each important field needs a rule. An email field needs a valid format. A customer ID needs uniqueness. A consent value needs an approved status. Revenue should come from an agreed-upon source system.

Clear rules reduce interpretation. They also give technical teams something measurable to test.

3. Ownership and Stewardship

Data quality fails rapidly when everyone uses the data and nobody owns it.

Each domain needs an owner who can approve definitions, review exceptions, resolve conflicts, and define acceptable quality levels. This is where data governance consulting supports stronger policies, stewardship models, and accountability.

4. Monitoring and Incident Management

Quality needs regular monitoring through dashboards, alerts, and exception reports. The aim is to catch problems early enough to prevent wider operational or reporting damage.

A duplicate profile, missing field, or broken format should move into a clear issue queue with ownership, severity, and resolution timelines.

5. Root Cause Correction

Cleaning records is only part of the work. If errors continue to appear, the source needs attention.

The cause may sit inside a form, integration, migration, manual upload, CRM process, or unclear business rule. Fixing the source protects future data.

Data Quality Metrics Worth Tracking

Data quality metrics translate the condition of data into measurable evidence. They show which records are dependable, which processes are leaking errors, and where risk is building.

Metric What It Measures Business Impact
Accuracy Correctness of values against trusted sources Reduces incorrect reports, offers, and customer records
Completeness Presence of all required fields Improves segmentation, compliance, and follow-up
Consistency Alignment of values across systems Clearer reporting and fewer cross-departmental conflicts
Timeliness Freshness of data at the moment of use Faster campaign, sales, and operational decisions
Uniqueness Absence of duplicate records Less repeated outreach and lower customer irritation
Validity Conformance with approved formats and rules Fewer workflow failures and processing errors
Integrity Strength of relationships between connected records More reliable reporting across linked data sets

The strongest metrics are linked to a decision, workflow, or business risk. Measuring every field creates noise. Measuring the right fields gives teams control.
Data quality consulting to fix data errors, improve governance, and ensure accurate business reporting.

Data Quality Management Tools and Where They Fit

Data quality management tools support profiling, validation, standardisation, deduplication, anomaly detection, monitoring, and issue tracking.

The right tool depends on the organisation’s data maturity. A smaller team may need validation rules, duplicate checks, and alerting. A larger enterprise may need data lineage, metadata management, catalogues, stewardship workflows, and quality scorecards across multiple systems.

Technical teams may also use testing and observability tools inside data pipelines. These checks examine whether data arrives on time, matches expected patterns, and remains usable after transformation.

For pipeline-heavy environments, dataops consulting services can connect quality checks to delivery workflows. This allows issues to surface before they affect reports, models, or customer-facing systems.

Best Practices for Better Data Quality Management

Define Data in Business Language

A technically valid field can still confuse teams. “Active customer” should mean the same thing in sales, marketing, finance, and support.

Place Controls at Entry Points

Forms, APIs, manual uploads, migrations, and integrations are common points of failure. Early validation prevents errors from travelling across systems.

Use Data Contracts Between Teams

When one system sends data to another, both sides should agree on structure, format, frequency, and required fields. Data contracts reduce breakage when systems change.

Review Quality With Business Owners

Data teams can detect anomalies. Business owners can judge the impact. Both views are needed for useful remediation.

Treat AI and Analytics as Quality-Sensitive Systems

AI models, forecasts, and dashboards inherit the condition of the data they receive. Weak input can distort scoring, recommendations, targeting, and automated decisions.
Data governance and data quality solutions that improve data structure, accuracy, and business decision-making.

FAQs

What is data quality management?

Data quality management is the discipline of controlling data accuracy, consistency, completeness, and usability across systems.

What is a data quality framework?

A data quality framework defines the rules, owners, metrics, tools, and workflows used to manage data quality.

Which data quality metrics should businesses track?

Accuracy, completeness, consistency, timeliness, uniqueness, validity, and integrity are the most useful data quality metrics.

Why is data quality important?

Data quality is important because poor data can affect reporting, compliance, customer experience, forecasting, and campaign performance.

What are data quality management tools?

Data quality management tools profile, validate, monitor, clean, standardise, and report issues across business data.

What are the benefits of data quality management?

The benefits include cleaner reporting, lower operational risk, stronger targeting, better compliance, and greater confidence in decisions.

How does data governance support data quality?

Data governance defines ownership, policies, and standards. Data quality checks whether those standards are followed in practice.
Categories
Blog Data Analytics Data Visualization

The $420 Billion Opportunity: How Data Analytics and BI Are Reshaping Every Industry in 2026

A business filled with data without a vision is a ship with cargo all over its back. That comparison has always felt accurate to me, and in 2026 it is more true than ever. The compass for the most serious organisations today is data analytics and BI.

By 2034, the global data analytics market will grow from USD 104.39 billion in 2026 to USD 495.87 billion, and big data and analytics will be worth USD 151.89 billion just this year.

That is not a forecast built on optimism. That is money already allocated, already moving, already producing returns in the companies paying attention.

Why the Numbers Keep Growing

The business intelligence market, estimated at USD 41.16 billion in 2026 and projected to grow at a CAGR of 8.67%, highlights the key importance of structured insights in strategic decision-making. As planning, forecasting, and performance reviews are all based on a consolidated analytics framework, the risks and costs of errors increase.

The broader data analytics market is expected to hit USD 495.87 billion by 2034, driven by cloud-based analytics, AI integration, and self-service business intelligence tools. This growth means that these tools are now the backbone of companies.

Data analytics services CTA banner encouraging businesses to turn data into actionable decisions with a Get in Touch button.

How Data Analytics and BI Are Reshaping Every Industry

Different industries are using analytics differently, but the pattern is the same in general.

Industry How analytics is reshaping it Business impact
Retail Demand forecasting, pricing optimization Fewer stockouts, tighter margins
Financial Services Risk monitoring, fraud detection Faster response, reduced exposure
Healthcare Capacity planning, operational visibility Better resource use, improved care delivery
Manufacturing Predictive maintenance, throughput tracking Lower downtime, steadier output
Logistics Route optimization, supply chain visibility Fewer delays, lower operational cost

For teams looking for a capable partner in this space, Data analytics services offer a structured path toward turning raw data into decisions that hold up under pressure.

Real-Time Business Intelligence and Predictive Analytics in 2026

Monthly reports used to feel timely. In some sectors, data that is 24 hours old is already too stale to trust.

Real-time business intelligence has changed how teams stay informed. Operations, sales, and finance can see what is happening now and respond without waiting for approval from layers. Predictive analytics adds the next step. 

The market is expected to be USD 27.56 billion in 2026 and is broad in scope, covering supply chain planning, churn prevention, risk modeling, and equipment maintenance. A working estimate of what is coming next helps teams position resources before the pressure arrives.

How AI-Powered BI Is Changing Analytics

AI is driving analytics forward, but the real benefit lies in how it can reduce friction for business users in the process. AI-driven BI spots patterns, identifies exceptions, and finds likely results without having to build a query from scratch. 

That means less searching through dashboards and more action on what the data already shows.

Augmented analytics supports this through data preparation, pattern recognition, and explanation. Improvado notes that BI teams in 2026 are shifting from reactive reports to proactive intelligence, using AI to flag anomalies and opportunities earlier. Many businesses start with What is Power BI before deciding which platform fits their workflow.

Why Embedded Analytics Changes Adoption

Analytics tools outside daily workflows often get ignored. Embedded analytics brings insights into the apps and systems where decisions already happen, improving adoption and supporting data democratization. When teams can access trusted data without waiting for a specialist, the business moves faster.

Gartner estimates that poor data quality costs organizations $9.7 million a year on average, making accessible, embedded, and well-governed analytics harder to ignore. Once core features are clear, teams can also compare top Power BI alternatives for scale, budget, and long-term fit.

What Makes a Data-Driven Business Strategy Work

I have watched organisations buy well-regarded analytics platforms and end up with dashboards nobody trusted six months later.

Same pattern every time. Two teams run the same report and get different numbers. A meeting gets spent arguing. Nothing gets decided. Same argument the following week. People go back to their own spreadsheets. 

A data-driven business strategy that functions requires clear ownership of data, shared definitions across every team, and a culture where insight comes before the decision. The companies making real progress start narrow. One forecasting process keeps missing. Churn nobody can explain. One metric, one source of truth. Expanding from there is easier once there is proof it works.

How Business Intelligence Analytics Drives Strategy

There is a version of BI that outputs reports. There is a version that changes what gets decided and when. The second one is where the value sits.

It shows up when the data running daily decisions is the same data as that feeding annual planning. Leaders stop reading filtered summaries and see what is actually driving performance. The argument about whose numbers are correct disappears, too. That argument wastes more time than most organisations want to count.

Data visualisation services often determine whether a finding gets acted on or noted and forgotten. A pattern that reads clearly in a well-built chart is easy to miss, buried in rows of numbers.

What the $420 Billion Opportunity Really Means

The total value of the data analytics and BI ecosystem, when including broader categories of big data, is approaching and may exceed USD 420 billion globally. This figure underscores how essential data analytics and business intelligence have become in the modern economy.

The companies that benefit most will not necessarily have the largest data teams. They will be the ones using data analytics and BI to make faster, better-informed calls across the business, combining the right tools with clear processes, strong governance, and a genuine commitment to acting on what the data says.

Business intelligence and data analytics CTA banner inviting businesses to talk to an expert for faster insights.

Making the Next Move Count

Good analytics is mostly invisible when it is working. The forecast that did not miss. The decision did not need reversing. The meeting that stayed on track because everyone had the same numbers.

That track record builds slowly and shows up in margins, retention, and how quickly the business can move when conditions shift. For teams looking for a steadier path, Augmented Systems can help shape that process. Data intelligence solutions can make the numbers far more useful when real decisions need to be made quickly. 

When you are ready, Contact Us, and we can work through what makes sense for your environment.

FAQs

1. What is data analytics and BI?

Data analytics and BI help businesses turn raw data into useful insights for planning, reporting, and decision-making. They make it easier to spot trends, track performance, and act on information with more confidence.

2. Why is data analytics and BI important in 2026?

In 2026, businesses need swift access to reliable insights to keep pace with rapidly changing markets. Data analytics and BI allow for real-time responses instead of relying on delayed reports.

3. How does data analytics reshape industries?

Data analytics reshapes industries by improving forecasting, reducing waste, and helping teams make better decisions.

4. What is the difference between business intelligence analytics and predictive analytics?

Business intelligence analytics focuses on understanding past and present events, while predictive analytics uses historical data to forecast future outcomes.

5. What is embedded analytics?

Embedded analytics integrates reports and dashboards into existing tools, making data more accessible without the need to switch platforms.

6. Why does data democratization matter?

Data democratization matters because it gives more people access to trusted data without depending on a small technical team.

Categories
Blog Data Analytics

Top 10 Data Analytics Software Tools in 2026: An Honest Comparison

Data has become a very persuasive talker. 

It whispers in charts, shouts in dashboards, and, if you are not careful, drags teams into meetings that solve nothing. 

The right data analytics software cuts through all of that noise and turns scattered numbers into something you can act on before the quarter slips through your fingers.

What I find most useful in 2026 is that the best platforms aren’t just measured on how many charts they can produce – rather, how well they help teams get from raw data to a decision without needing three different people and a long coffee break.

That’s where the magic lies. If your team needs wider support, Augmented Systems can help with setup and rollout.

What Makes a Tool Worth Using?

A strong data analytics software stack needs more than polished visuals. It should connect data sources cleanly, handle scale without choking, support collaboration, and give users a path from exploration to action. If the tool only looks good in a demo, it’ll usually disappoint in the real world.

I have seen teams fall for a feature list and then spend months working around it. A better filter is simple: can the tool support your current workflow and your next stage of growth? That question removes a lot of noise very quickly.

Contact our team for expert recommendations on choosing the best data analytics software for your business.

Best Data Analytics Software Tools in 2026

1. Microsoft Power BI

Power BI is an excellent choice for businesses already living in the Microsoft ecosystem. It handles reporting well, connects with familiar data sources, and gives finance, sales, and operations teams a decent balance of control and speed.

Its biggest strength is adoption. People use it because it fits into existing habits. If you need a broad data analytics tool with low learning time, Power BI just won’t quit for a reason.

2. Tableau

Tableau is still a strong option for teams that care deeply about dashboard visuals. It gives analysts the room to build layered, detailed dashboards that help patterns stand out without flattening the data.

It works best when visual clarity matters as much as technical stuff. In the Power BI vs Tableau debate, Tableau tends to draw in teams that want more design freedom and a richer visual language.

3. Looker

Looker is a solid choice for organisations that want governed reporting and a cleaner semantic layer. It’s great when one version of the truth matters more than quick one-off dashboards.

That makes it valuable for larger teams where data consistency is non-negotiable. For many businesses, this is where tools in data analytics stop being a convenience and start becoming infrastructure.

4. Qlik Sense

Qlik Sense is strong when users need associative exploration rather than a fixed reporting path. It helps analysts move across data relationships without getting boxed into a single query route.

This makes it useful for discovery-heavy work. If your team often asks follow-up questions after the first answer, Qlik Sense can keep up better than a more rigid platform.

5. Apache Superset

Apache Superset is worth attention for teams exploring open source data analytics software. It offers flexibility, strong visualisation potential, and the advantage of not locking you into a closed commercial model.

It is best for teams with technical strength in-house. If you want a platform you can shape more freely, this is one of the more credible open source data analytics software options on the market.

6. Google Looker Studio

Looker is a solid choice for organisations that want governed reporting and a cleaner semantic layer. It works well when one version of the truth matters more than quick one-off dashboards.

For marketing teams and small businesses, it often feels like the shortest route from data to something presentable. It is one of those data analytics software that gets used more because it removes friction.

7. Sisense

Sisense works well when embedded analytics becomes part of the product or customer experience. It’s built for organisations that want to put insights inside apps rather than keep them in a separate reporting layer.

That matters in product-led environments where the dashboard isn’t the destination. The insight needs to show up where you are.

8. Domo

Domo is a cloud-first platform that emphasizes collaboration, data blending, and operational visibility. It is beneficial for business users who need access without relying heavily on technical teams for every report.

This is one reason many teams treat it as a cloud analytics platform rather than a pure BI tool. It gives non-technical users more room to work with live data.

9. Mode

Mode is a good fit for analysts who work close to SQL, notebooks, and custom analysis. It blends exploration and reporting in a way that feels more natural for technical teams.

If your analysts want to move quickly from query to presentation, Mode keeps the workflow tight. It is a reminder that not every best data analytics software choice is meant for everyone in the company.

10. ThoughtSpot

ThoughtSpot stands out for search-driven analytics and AI-supported querying. It helps users ask questions in plain language and get useful answers without having to know the query logic upfront.

That makes it particularly interesting for the rise of AI-powered analytics and agentic analytics. In my view, this is where the category starts to feel less like reporting and more like a decision assistant.

Get expert guidance to compare and select the right data analytics platform for your organization.

Which Tool Fits Which Need

If your team needs data visualization services, Tableau and Power BI usually sit near the top of the shortlist because they make reporting easy to share and easier to defend in meetings.

Need Strong Fit
Visual storytelling Tableau
Microsoft ecosystem Power BI
Governed reporting Looker
Technical analysis Mode
Open source control Apache Superset
Quick marketing reporting Looker Studio
Embedded analytics Sisense
Collaboration Domo
AI-assisted queries ThoughtSpot
Discovery-heavy analysis Qlik Sense

A good data analytics tools comparison should help you choose fit over fame. The platform needs to match your team’s workflow, or the buying decision can quickly go off the rails. Data analytics services can support everything from selection to setup.

How to Choose Wisely?

The best approach is to map the tool to the job before comparing prices. Distributed teams may need a cloud analytics platform, technical teams may want flexibility, and business teams may prefer speed and simplicity.

If I had to distil my rule down to just one, it’d be this: buy for the workflow, not the brochure. A platform that impresses in a sales call can still wind up being an expensive drawer item if no one uses it after week two.

A good grasp of data analytics tools and techniques helps teams spot the gap between a shiny demo and a tool that will actually pull its weight.

FAQ

1. What is the best data analytics software for small businesses?

For small businesses, the best data analytics software is typically easy to deploy and user-friendly. Power BI and Looker Studio are popular choices due to their quick setup and minimal training needs.

2. Which data analytics tools are best for enterprise teams?

Enterprise teams usually need governed reporting, strong permissions, and scalable collaboration. Looker, Tableau, and Domo often work well when many stakeholders need the same trusted data.

3. Is open source data analytics software reliable?

Yes, if your team has the technical skills. Open-source data analytics software like Apache Superset is flexible but requires more hands-on support than plug-and-play tools.

4. What is the difference between Power BI and Tableau?

Choosing between Power BI and Tableau often depends on workflow and visual preferences. Power BI is ideal for Microsoft-centric teams, while Tableau is preferred for advanced visual storytelling.

5. What are real-time analytics tools used for?

Real-time analytics tools allow teams to monitor activity, detect anomalies quickly, and respond before issues escalate. They are useful in operations, marketing, support, and product monitoring.

6. What does agentic analytics mean?

Agentic analytics are systems that interpret signals, suggest actions, and shorten the time between questions and decisions.

Categories
Blog Data Analytics

Data Analytics with Tableau: How AI-Powered Features Help Teams Find Insights Faster

Trying to find the right number in a crowded dashboard can feel like hunting for a pin in a haystack. 

Tableau turns that tangle into something readable, usable, and far easier to act upon.

Data analytics with Tableau gives teams a more effective way to spot patterns, monitor performance, and make decisions before the moment passes. 

For a tech and innovation brand like Augmented Lab, that means data becomes something people can work with, rather than merely stare at.

Why Data Analytics with Tableau Changes the Pace of Analysis

A well-designed dashboard can still require a lot from the reader. Someone needs to ask the right questions, look at the right data, and connect the pieces before taking action.

Tableau’s AI-powered features reduce that delay. A finance team can review margin movement, a marketing team can track campaign shifts, and an operations team can catch performance issues without waiting for a manual report cycle.

That speed is important because insight has a shelf life. When a pattern is visible while the issue is still live, the response tends to be sharper and more useful.

Tableau Pulse for Daily Visibility

Tableau Pulse is designed for the metrics that people frequently check. It monitors key performance signals and presents changes in simple language, helping teams stay informed without spending all day on a dashboard.

You can use Tableau Pulse when your organisation checks the things over and over, like how much money you make or how many people stop using your service. For example, a sales manager can quickly identify a drop in conversion rates and investigate the cause before the week is over.

If reporting needs a stronger structure around the metrics layer, data analytics services can help shape the foundation before AI-led summaries are layered on top.

It works best when the metric definitions are stable and well governed. If the KPI logic shifts too often, the summaries will feel less trustworthy.

Still chasing insights by hand? We help teams get more from every Tableau view - Contact us

Conversational Analytics for Faster Questions

Conversational analytics gives users a more natural way to explore data. Instead of building every view from scratch, the user asks a question and gets guided towards the relevant pattern.

It is beneficial when stakeholders understand the business issue but not the chart structure. A product lead might inquire about the decline in sign-ups and then analyze the data by source, region, or device to identify the cause.

For teams with mixed technical skills, data analytics with Tableau becomes far more approachable. Analysts still retain depth, while business users gain a clearer route into the data.

Tableau Ask Data and Discover

Tableau Ask Data works well for a focused question that needs a fast answer. In contrast, Discover is more useful when several related metrics need to be understood together.

This distinction matters in day-to-day work. Tableau Ask Data suits a quick review before a meeting, while Discover helps leadership see the wider story behind a change in performance.

Feature Best use Practical value
Tableau Ask Data Single question Fast answer for one metric
Discover Multiple related metrics Broader context and trend review

If the output needs a sharper visual layer for stakeholders, data visualization services can help make the insight easier to read at a glance.

Tableau Agent for Drafting and Exploration

With Tableau Agent, users can build visualisations, explain fields, and support analysis inside the platform. It is useful when a team wants a first draft before spending time on refinement.

That makes it a sensible tool for analysts who already know the business objective. A growth analyst can create a summary dashboard, analyze the results, and refine both the data and the accompanying narrative. 

It should be used as a supportive tool rather than a definitive source. While AI can expedite the initial process, human judgment is essential for interpreting the business context.

Tableau Next Feature and Agentic Analytics

Tableau Next points towards a more autonomous style of analytics. It supports agentic analytics, where the platform can monitor data, surface relevant insight, and move information towards action with less manual prompting.

That matters in operational settings where delays create pressure. A logistics team can use it to watch fulfilment performance, detect a delay pattern, and alert the right people before the issue spreads.

When teams want a broader strategic partner for analytics and implementation,  Augmented Systems can support the wider business setup around data, reporting, and delivery.

Feature What it supports Example use
Tableau Pulse Metric monitoring Daily KPI checks
Tableau Ask Data Question-based exploration Single business question
Discover Broader insight review Multi-metric performance review
Tableau Agent Drafting and analysis support Faster chart and field creation
Tableau Next Agentic workflows More proactive insight delivery

Where Teams Get the Most Value

The best results usually come from teams that already know their core metrics. If the data model is stable and the KPI definitions are clear, Tableau’s AI layer has a stronger foundation to work from.

Use data analytics with Tableau when the aim is to reduce the time between spotting a shift and responding to it. Marketing can use it for campaign tracking, finance can use it for variance review, and operations can use it for exception monitoring.

The real gain is not simply speed. It is confidence in the insight and clarity in the next step.

A Practical Rollout Approach

A phased rollout is often more effective than a full implementation. 

  • Start with one department and a small group of key metrics.
  • Define KPI logic before enabling AI-supported insight layers.
  • Train users to ask specific questions instead of broad ones.
  • Review AI-generated summaries against source data during the first phase.
  • Add more advanced workflows after the core reporting process feels stable.

This approach keeps the system useful instead of noisy. It also gives the team time to trust the output before wider adoption.

Conclusion

Data analytics with Tableau works best when teams want answers that arrive with less fuss. Its AI-powered features help turn scattered numbers into something people can actually work with.

When the reporting setup needs a steadier hand, that is where Augmented Lab comes in. We help shape Tableau into a setup that feels more useful, more practical, and far less of a slog.

Ready to improve your Tableau workflow? Contact us and schedule a quick call with our team today.

Does your data support the decisions you need? We help improve how Tableau works for your team – Talk to an expert

FAQs

1. What is data analytics with Tableau?

Data analytics with Tableau utilizes its visual and AI-powered features to explore data and uncover insights. This approach enables teams to transition from raw numbers to informed business decisions with reduced manual effort.

2. How does Tableau Pulse help with reporting?

Tableau Pulse monitors key metrics and highlights important changes in plain language. It is useful for teams that need ongoing visibility without constantly checking dashboards.

3. What is Tableau Agent used for?

Tableau Agent helps users draft charts, explain fields, and explore data more efficiently. It works well when teams want a fast first version before refining the analysis.

4. How is Ask Q&A different from Discover?

Ask Q&A is better for one focused question, while Discover is better for related metrics and broader context. In data analytics with Tableau, both help users move faster through analysis.

5. What is Tableau Next?

Tableau Next is Tableau’s agentic analytics platform. It supports more proactive insight delivery and helps teams move towards automated, multi-step analysis.

6. Why should businesses use AI-powered analytics in Tableau?

Businesses should utilize AI-powered analytics in Tableau to minimize reporting delays and identify meaningful patterns more quickly. This allows teams more time to act on insights.

Categories
Blog Data Analytics

Data Engineering: How to Build the Right Team for Your Business

Every modern business aims to be data-driven today.

But most businesses fail to build the right team that can make it happen.

To help you avoid the same trap, I have created this guide. It will help you create the right data engineering team for your company.

With this guide, you will learn answers to important questions. Questions like “What does a data engineer do?.

Moreover, you will also learn how to implement key data engineering best practices.

Let’s get started.

What is Data Engineering?

Data engineering is the process of collecting and preparing data for analysis.

With data engineers, you can build the first step towards gaining insights from your data.

After data engineers prepare the data, data analysts can derive the right analytics.

Data engineers are also responsible for creating the right data pipeline architecture. This is what moves your data from its source to the destination.

Thus, data engineers are responsible for:

  • Collecting your data 
  • Cleaning and preparing your data 
  • Migrating your data for analysis

What Does a Data Engineer Do?

Here are the main steps data engineers perform:

Task What It Means
Data ingestion Pulling data from databases into one place
Data transformation Cleaning and formatting data for analysis
Pipeline building Creating automated systems to move data
Data quality Checking that data is accurate and complete


Data Engineering Team Structure

Wondering how you can structure your data engineering team properly?

Here is a simple guide to do so:

Team Size Roles to Hire
Small (1-2 people) One data engineer who builds basic pipelines
Growing (3-5 people) Add senior data engineer + analytics engineer
Enterprise (6+ people) Specialized roles + data architect


Small Business (1 – 2 People)

If you are a startup or emerging business, consider hiring only one data engineer.

They can handle your initial data collection and analytics.

Make sure to use tools like Airbyte or Fivetran to maintain your pipeline.

Growing Team (3 – 5 People)

To scale your business, consider adding a senior data engineer. They can help you design a robust data architecture.

Moreover, hiring an analytics engineer can help manage your data quality. They can also help you in understanding Power BI dataflows and other important platforms.

Enterprise (6+ People)

Now it’s time to build specialized roles. This includes pipeline engineers and platform engineers.

Moreover, expand your analytics engineering team to keep up.

hire data engineering team from augmented systems experts

Data Pipeline Architecture

Your data pipeline architecture guides how your data moves through systems.

A typical modern pipeline follows this medallion structure:

Layer What It Contains Purpose
Bronze Raw data as received Immutable source of truth
Silver Cleaned and validated data Trusted for analysis
Gold Aggregated, business-ready data Dashboards and reporting


Data Engineering Best Practices

Here are the most essential data engineering best practices:

  • Always Be Ready to Rebuild

As technology progresses, you need to adapt as well.

Make sure you can rebuild your entire data warehouse from your source data.

This ensures you have a recovery path in case of issues.

  • Test Everything

Make it a habit to test your data at every stage.

This includes validating your data and transformational logic.

Moreover, perform final checks on data outputs.

  • Recheck Your Pipeline Effeciency

Running your data pipelines twice should render the same result.

Make sure your pipeline is accurate and responsive.

  • Document your Data

Proper documentation of your data is very important.

It enables better scheduling and refined data pipelines.

  • Monitor Continuously

Set up alerts for any pipeline failures or data issues.

This will ensure you can fix your problems before they affect your users.

Data Engineering Services: Build or Outsource?

Considering whether you should hire or outsource your data engineers?

Here is what I recommend:

Situation Recommendation
You have 0-1 data people Outsource to get started faster
Data is core to your product Hire in-house engineers
You have a one-time migration Outsource the project
You’re a startup with funding Hire a senior engineer first


data pipeline architecture services to fix data chaos and improve workflow

 Conclusion

Building the right data engineering team cannot happen overnight.

It is a slow process that takes time to build the right data foundation.

Make sure that you follow all data engineering best practices from day one. Moreover, regular testing and quality checks are always beneficial.

Also, your data engineering team structure needs to scale with your needs.

Still unsure where to start with your data engineering needs?

Consider partnering with Augmented Systems’ data engineering services. Our experts provide the best way to build your data pipeline’s initial stages.

Whether it’s data engineering, data analytics services, or architecture, we can help. Our experts have years of experience in delivering reliable data insights.

Contact Augmented Systems today to receive a free consultation for your data engineering needs.

FAQs 

1. What is data engineering?

Data engineering is the practice of building systems that collect, store, and prepare data for analysis. It’s the foundation that enables data scientists and analysts to do their jobs effectively.

2. What does a data engineer do?

So, what does a data engineer do? They build data pipelines, clean and transform data, ensure data quality, and create automated systems that move data from sources to destinations, such as data warehouses.

3. What is a good data engineering team structure?

A data engineering team structure starts with one data engineer for small teams, adds a senior engineer and an analytics engineer for growing teams, and includes specialized roles like a data architect for enterprise-scale teams.

4. What are key data engineering best practices?

Data engineering best practices include building idempotent pipelines (that produce the same results every time), testing everything, documenting as you build, monitoring continuously, and always being able to rebuild from raw data.

5. What is data pipeline architecture?

Data pipeline architecture is the blueprint for how data moves through your systems. A modern approach uses a medallion structure with bronze (raw), silver (cleaned), and gold (business-ready) layers.

Categories
Blog Data Analytics

What Is a Data Lakehouse? Architecture, Benefits & Real-World Use Case

Own a data-centric business?

Then you must know how tough it is to choose between a data lake and a data warehouse.

Data lakes are a cheap way to store your data. But they can quickly turn messy.

Meanwhile, data warehouses are very fast and cleaner. But they can be very expensive and non-customizable.

So which one would you choose?

Neither, because there is an even better third option! It’s called a data lakehouse.

In this guide, I will help you understand what a data lakehouse is. I will also walk through the entire data lakehouse architecture.

Moreover, we will also discuss real-life data lakehouse examples.

Let’s first begin by understanding more about what a data lakehouse stands for.

What is a Data Lakehouse?

A data lakehouse is a modern data platform that combines the benefits of a data lake and data warehouse.

Let me explain it with this simple table:

Traditional Data Lake Traditional Data Warehouse Data Lakehouse
Stores all raw data cheaply Stores cleaned and structured data Stores everything in one place
It can become messy and hard to use Fast SQL queries and BI-ready Fast queries + raw data flexibility
Great for data scientists Great for business analysts Great for everyone


Data Lakehouse vs Data Warehouse vs Data Lake

For easier understanding, here is a detailed comparison between these three techniques:

Feature Data Lake Data Warehouse Data Lakehouse
Data types Raw, unstructured, semi-structured Structured only All types supported
Schema approach Schema-on-read (apply when reading) Schema-on-write (apply before storing) Both approaches work
Primary users Data scientists, engineers Business analysts Everyone
Query performance Slower, needs tuning Very fast Fast (warehouse-like)
Cost Cheap storage Expensive Balanced
ACID transactions Limited support Full support Full support


Data Lakehouse Architecture

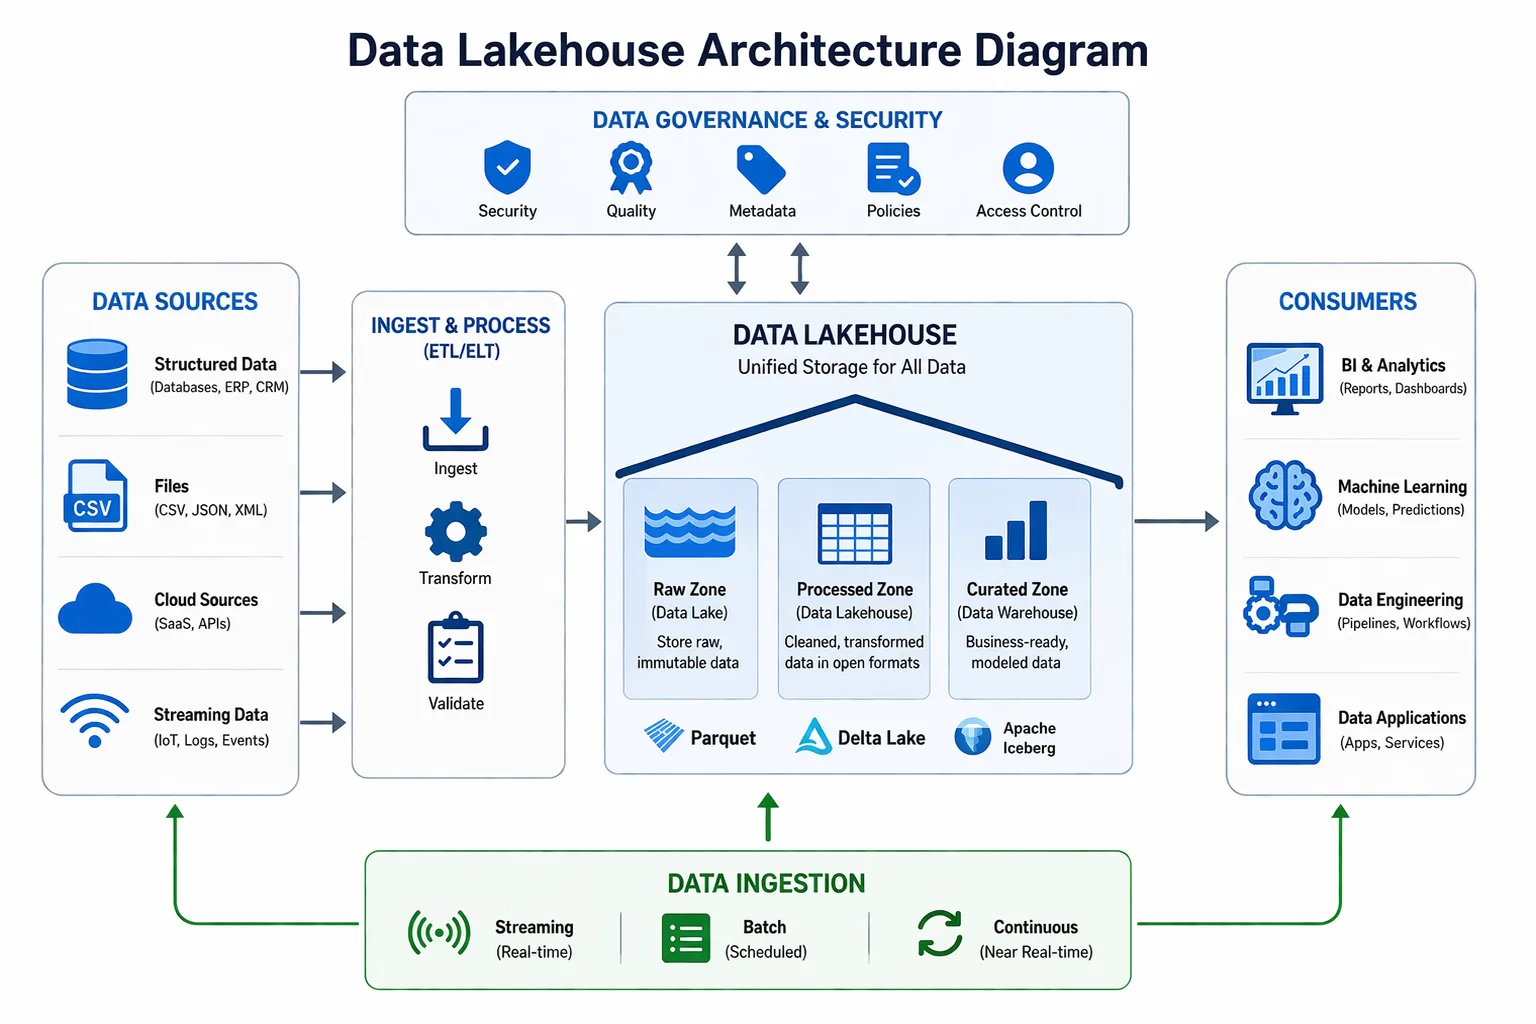
Data lakehouse architecture diagram showing data ingestion, storage, processing, metadata, and serving layers

For a typical data lakehouse to work, you need several layers. These layers work together to store your data efficiently.

The five main key layers of this architecture include:

  • Ingestion

This layer brings data in from multiple sources.

Examples include Kafka and Lakeflow Connect.

  • Storage

To keep your raw and processed data in store, this layer is necessary.

It includes examples like S3 and ADLS.

  • Metadata & Catalog

Simply having your data stored is not enough.

It also needs to be organized and indexed. This is the layer that makes it all happen.

Examples include Unity Catalog and AWS Glue.

  • Processing

When you want to retrieve your data, it needs to be processed.

This is the layer that both transforms and queries your data. Examples include Spark and Photon Engine.

  • Serving

When the data is ready, this layer delivers it to the users.

Often, this layer is also used to provide insights to the users.

Common examples include BI tools and dashboards.

Key Data Lakehouse Benefits

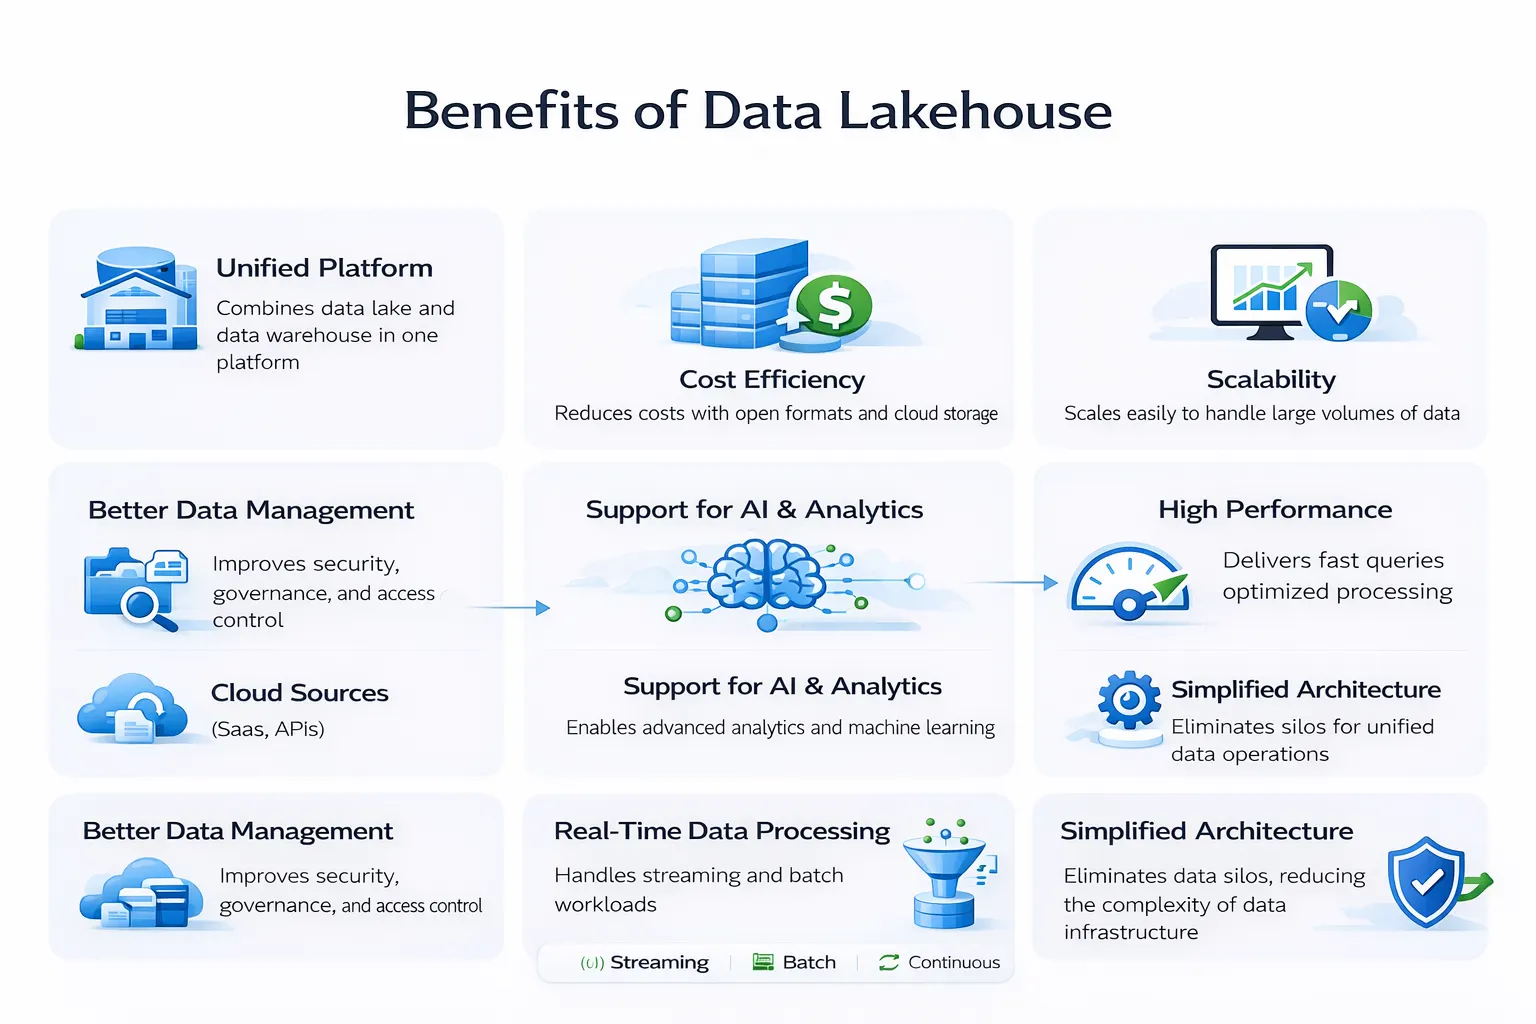
Benefits of data lakehouse including cost efficiency scalability real time processing and unified data platform

Here are some of the benefits of a data lakehouse that can be very beneficial for your business:

Benefit What It Means for You
Lower costs Only one storage system is required instead of two
Fresher data Query data processed within minutes of arrival
Less duplication No more copying data between the lake and the warehouse
One source of truth Everyone works from the same data
Flexible for all users Data scientists and business analysts can use the same platform


Unify your data with modern data lakehouse architecture by Augmented Systems

Real-World Data Lakehouse Examples

Here are actual real-life scenarios of data lakehouses in action:

  • Hallmark 

The greeting card company Hallmark modernized its data platform using a lakehouse.

As their data was becoming expensive to operate, this strategy helped them save money.

By rebuilding their data storage with Unity Catalog, they successfully reduced costs by 80%.

  • WeChat

The famous chat app WeChat migrated from a separate system to Lakehouse.

They used Apache Iceberg to reduce duplicated pipelines and data maintenance.

With the lakehouse platform for storage, they benefited from 65% storage savings.

  • Walmart

Walmart modernized its data lakes using Apache Hudi to implement a lakehouse architecture.

This enabled them to reduce data duplicates and streamline data availability.

Moreover, Apache Hudi also provided quick updates and projected changes.

Data Lakehouse Tools and Platforms

Here are the best platforms you can use to implement data lakehouse tools:

Platform Key Strengths
Databricks Unity Catalog governance and Photon engine
AWS SageMaker lakehouse and Iceberg support
Azure ADLS storage and Azure Databricks integration
Open Source Delta Lake and Apache Hudi table formats


What are the Data Lakehouse Implementation Steps?

Here is how you can build your own data lakehouse:

  1. Choose the perfect storage layer, like Delta Lake or Iceberg
  2. Ensure you set up your ingestion using tools like Kafka
  3. Establish total governance by implementing a data access tool 
  4. Connect your serving tools, like BI or SQL, for easy access

Data lakehouse design services to replace separate data lake and data warehouse systems

Conclusion

For any modern business, data lakehouse architecture provides a host of benefits.

As companies like Hallmark and WeChat have proven, they are reliable and efficient.

Alongside quicker data access, data lakehouses can also save you money.

So if you are tired of managing separate systems, it’s time to switch. Just use a data migration framework to move your data into a lakehouse.

Here is how you can make it happen.

Partner with Augmented Systems today and let us help make your business more efficient. This means implementing modern architectures, such as lakehouses, within your current setup.

Moreover, our team can help you get the perfect data strategy for your business. This lets you reap benefits at a lower cost.

Are you ready to unify your data? Contact Augmented Systems today for a free consultation! 

FAQs 

1. What is a data lakehouse in simple terms?

A data lakehouse combines the best of data lakes and data warehouses. It stores all your raw data cheaply like a lake, but lets you query it quickly like a warehouse. No more managing two separate systems.

2. What is the difference between a data lakehouse and a data warehouse?

The main data lakehouse vs data warehouse difference is flexibility. Data warehouses handle only structured data and require rigid schemas upfront. Data lakehouses handle all data types and support both fast SQL queries and data science workloads.

3. What does data lakehouse architecture look like?

Data lakehouse architecture has five layers: ingestion (bringing data in), storage (keeping raw and processed data), metadata (organizing everything), processing (transforming data), and serving (delivering insights). Open table formats like Delta Lake and Iceberg make it work.

4. What are the key data lakehouse benefits?

Data lakehouse benefits include lower costs (Hallmark saved nearly 80%), fresher data (queries within minutes), no data duplication, a single source of truth for everyone, and support for both SQL analytics and machine learning on the same platform.

5. What are popular data lakehouse tools?

Leading data lakehouse tools include Databricks (with Unity Catalog and Lakeflow Connect), AWS (SageMaker lakehouse), Azure (ADLS storage), and open table formats like Delta Lake, Apache Iceberg, and Apache Hudi for reliable data management.

Categories
Blog Data Analytics

Data Mesh Architecture: A Practical Guide for Modern Enterprises

As traditional data architecture struggles to keep up, modern changes are required.

You are probably struggling with similar data issues as well. Problems that force you to find your data every day across your sales, marketing, and finance departments.

To prevent this lack of organisation from harming your productivity, you need a better solution. Something that makes every department responsible for its own data.

Something that nullifies the need for a standalone central data team.

This is exactly what data mesh architecture aims to solve. Instead of centralising your data and hiring a team to perform checks, it puts your departments in charge of their own data.

Through this strategy, your central team bottlenecks are massively reduced. Also, it reduces confusion, as the team handling the data knows everything about it.

So are you excited to learn more about data mesh principles and benefits?

Let’s get started with a quick introduction to its basics.

What is Data Mesh Architecture?

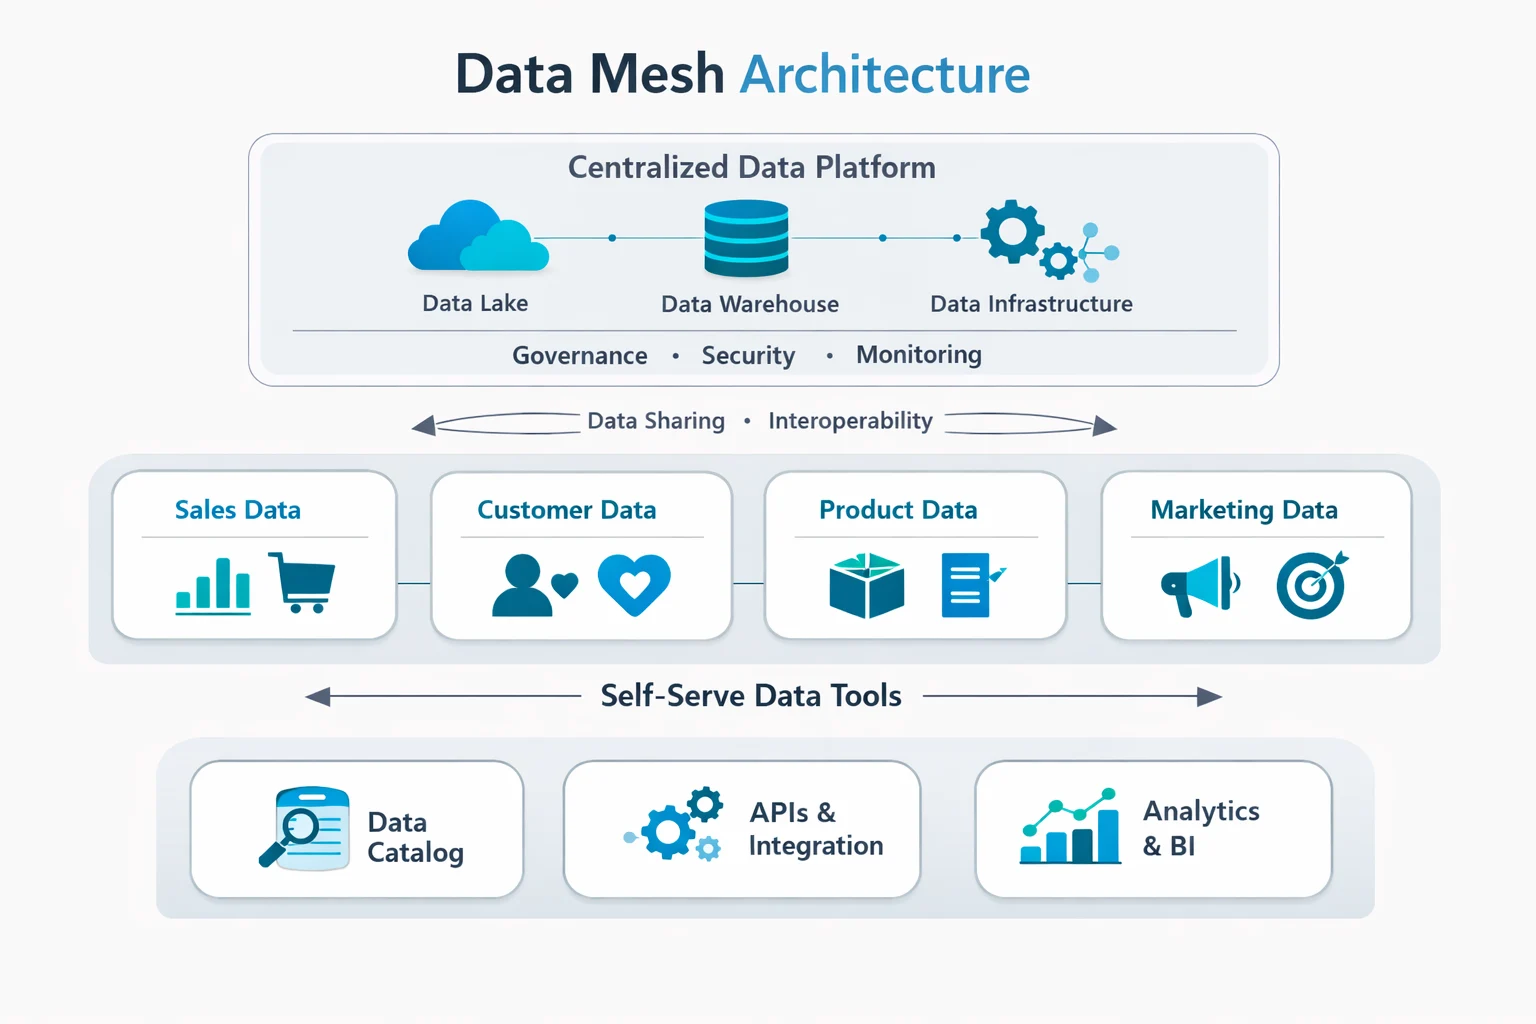
Data mesh architecture diagram showing centralized platform, domain data ownership, and self-service data tools

Data mesh is a decentralized approach to data architecture. It is an innovative concept that is quickly gaining popularity due to its significant improvements.

In this strategy, each domain team treats its created data as a product. These include domain teams such as sales, marketing, or customer service in your company.

As the teams both own and maintain their data, it eliminates the need for a central team. This minimizes confusion and develops a shared understanding between teams.

The 4 Core Data Mesh Principles 

Any successful data mesh architecture depends mainly on these data mesh principles:

Principle What It Means
Domain Ownership Each business domain is in charge of its data
Data as a Product Data is treated like a customer product that should be quality assured
Self-Service Platform Using a platform to help domains manage data themselves
Federated Governance Implementing global standards on local domain data 


  • Domain Ownership

It is very important to let your domain teams take charge of their data. This shifts the pressure from a central team owning everything to letting the domain take ownership.

As sales manages sales data and marketing owns campaign data, productivity increases. It lets the people who understand the data best manage it as well.

  • Data as a Product

Domain teams treat their datasets much like any other company product. This means ensuring:

  • Clear documentation of the data
  • Ensuring its quality
  • Providing easy accessibility

Such changes make your data products more trustworthy and easier to discover.

Make sure you use a smart approach to application integration to make this process easier.

  • Self-Service Platform

Using a self-service platform provides everything your domain teams require. It lets them both create and maintain their data without relying on a central team.

  • Federated Governance

Even though domains showcase autonomy, they will still follow your common rules. This means implementing global standards that ensure their regulation without sacrificing flexibility.

Why Should You Move to Data Mesh?

Companies usually adopt a data mesh architecture for reasons like:

Challenge with Centralized Models How Data Mesh Helps
The central team becomes a bottleneck Domains work independently
Slow time-to-insight Data products are available immediately
Poor data quality Domain experts own quality directly
Rigid structures Scales naturally with organization


Data Mesh Implementation: How to Get Started

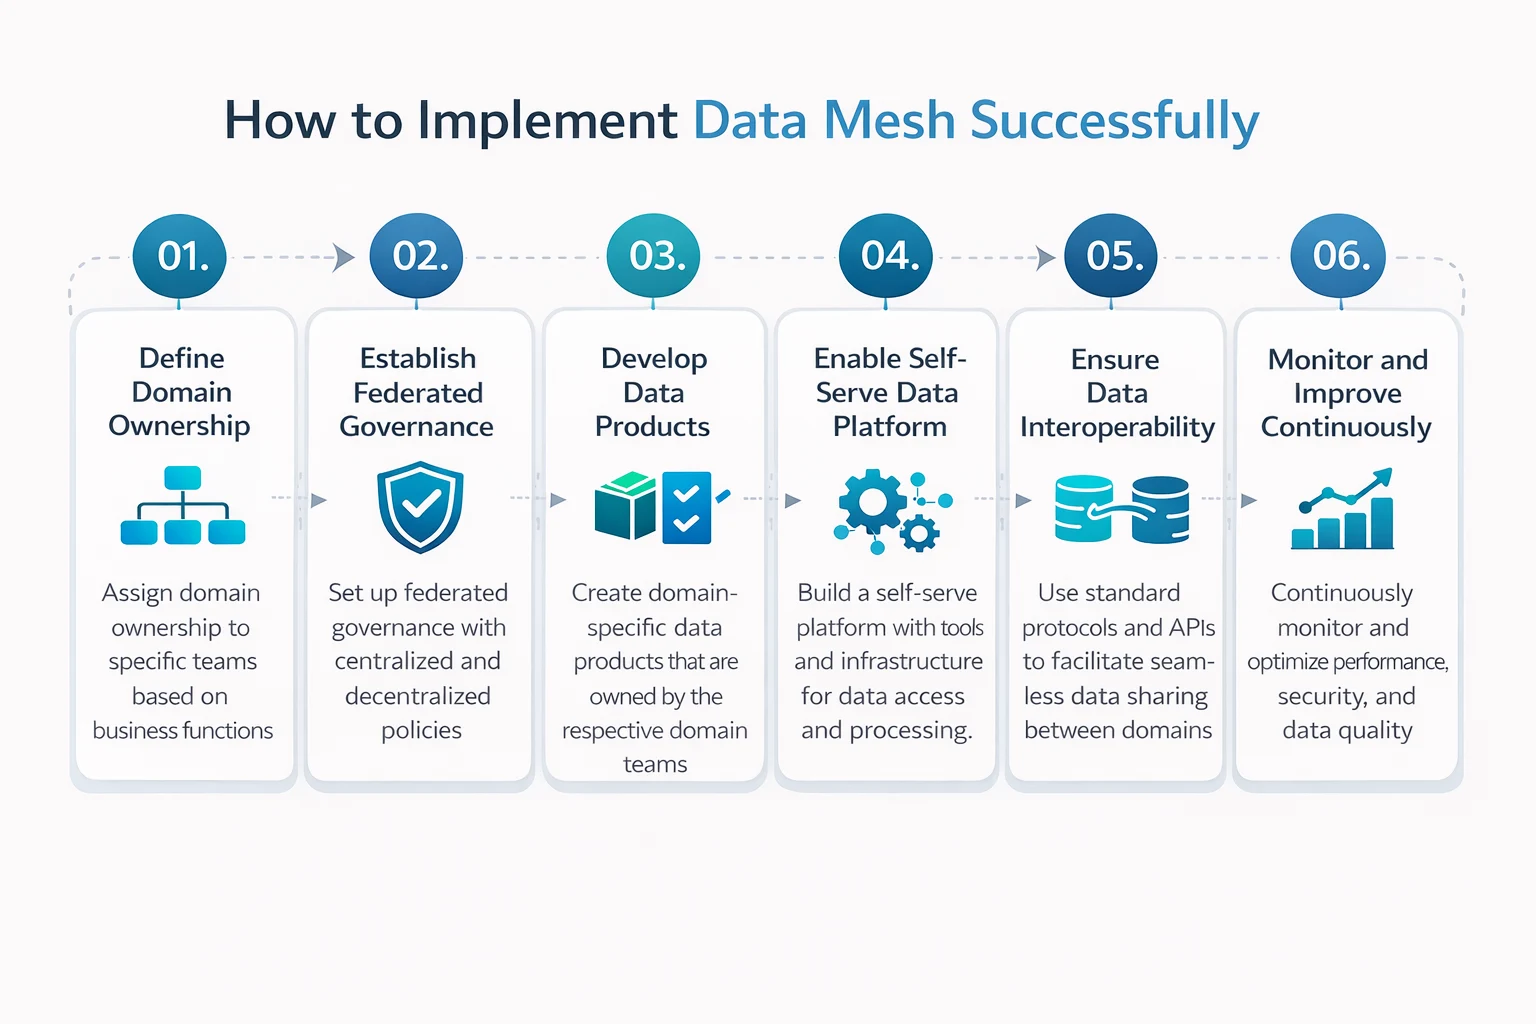
Data mesh implementation steps showing domain ownership, governance, data products, and self-service platform setup

Every successful data mesh implementation is the result of following these steps:

Step 1: Identifying Domains

Start your implementation by identifying which business domains will benefit from data autonomy.

Ensure you choose only motivated teams already displaying clear boundaries.

Step 2: Establish Standards

Always define what a good data product should look like before your decentralization. This will ensure your team knows exactly what quality and accessibility you require.

Step 3: Builds Self-Service Platforms

Always invest in platforms that empower your domain teams. Do not prioritize apps that require a central IT infrastructure.

Step 4: Enable Domains

Your domain teams should be trained on efficient data product management. This will help them as they transition from data producers to managers.

Step 5: Evolve Governance

Your new governance should control access without disrupting innovation. Ensure your rules promote collaboration.

Data mesh consulting services CTA for enterprise data transformation

Data Mesh on AWS and Azure

Let’s understand how you should approach data mesh AWS and data mesh Azure:

Data Mesh on AWS

Your AWS services support data mesh capabilities like:

AWS Service Role in Data Mesh
AWS Lake Formation Central governance, fine-grained access control
AWS Glue Data Catalog Metadata federation across domains
Amazon S3 Scalable storage for data products
AWS DataZone Data discovery and sharing

A key enabler for data mesh in AWS is also Apache Iceberg. This provides an open table format that makes data easily accessible.

Data Mesh on Azure

For data mesh Azure implementations, consider:

Azure Service Role in Data Mesh
Azure Data Lake Storage Central storage for data products
Azure Purview Data catalog and governance
Azure Synapse Analytics Analytics across domains


Microsoft experts clarify that you do not need a separate data lake for each department when using Azure.

Thus, you can easily tweak your Azure to let domains own their data products easily.

Data Mesh on Databricks

Using the Databricks Unity Catalog, you can provide universal governance across both data and AI assets.

It supports key data mesh requirements and can help you organize your independent workflows for better data intelligence. 

Data Mesh Governance

As data mesh involves decentralization, governance can become tricky.

Make sure you use modern approaches and trends like:

Approaches / Trends Description
Data Product Contracts Domains publish SLAs for quality, freshness
Federated Councils Cross-functional teams set global standards
Self-Service Policies Domains apply governance via templates
Platform-Centric Enablement Governance as code embedded in the platform

Common Challenges of Data Mesh Architecture Implementation

Integrating data mesh in your company can pose challenges like:

Challenge How to Address
Cultural resistance Start with pilot domains, demonstrate value
Technical complexity Invest in self-service platforms first
Governance consistency Use federated councils
Cross-domain discovery Implement enterprise catalogs
Access control Leverage platform capabilities


Data mesh solution to break down data silos and build scalable data architecture

Conclusion

Data mesh architecture is truly a fundamental shift that can change how your enterprise handles data.

It overturns centralized control and promotes distributed ownership of data. While it may sound tricky, its actual implementation has a ton of new benefits.

Using data mesh in your company can lead to better innovations and improved data quality.

Ready to successfully implement data mesh architecture in your company? Let the experts of Augmented Systems provide you with the best strategy!

With years of experience in transforming company data architectures, we know exactly what you require. Our specialization in consulting global enterprises can surely make this data transformation a lot more efficient.

Let us help you break free from your data silos! Contact Augmented Systems today to receive the software consultation you require.

FAQs 

1. What is data mesh architecture?

Data mesh architecture is a decentralized approach to data management in which business domains (such as sales, marketing, and finance) own their data and treat it as a product. It shifts away from centralized data lakes toward distributed, domain-oriented ownership.

2. What are the four data mesh principles?

The four data mesh principles are domain-oriented ownership, data as a product, self-service data infrastructure, and federated governance. Together, they create a scalable, decentralized data architecture that empowers domain teams.

3. How do I start data mesh implementation?

A successful data mesh implementation begins with identifying pilot domains, establishing clear data product standards, building self-service platforms, enabling domain teams with training, and evolving governance from control to enablement.

4. Can I implement data mesh on AWS or Azure?

Yes. Data mesh AWS implementations use services like Lake Formation, Glue Data Catalog, and DataZone. Data mesh Azure implementations leverage Azure Data Lake Storage, Purview, and Synapse Analytics. Both support decentralized data ownership within shared platforms.

5. What role does Databricks play in data mesh?

Data mesh Databricks implementations use Unity Catalog to provide unified governance across data and AI assets. It enables domain teams to manage data products while maintaining global standards and security across multi-cloud environments.

Categories
Blog Data Analytics

Real-Time Data Analytics: Benefits, Use Cases & Implementation Strategy

Still waiting on your data analytics to create your strategy?

Waiting until tomorrow to know what happened today is no longer viable. While you are stuck on “calculating”, your competitors have already begun their strategy execution.

That is where real-time data analytics comes in. They fundamentally change the way you use your data for improvements.

In this guide, I will help you understand exactly what real-time analytics is. We will also explore why it matters and how you can implement it within your own business.

Ready to learn something new about the modern way of using your data? Let’s get started!

What is Real-Time Analytics?

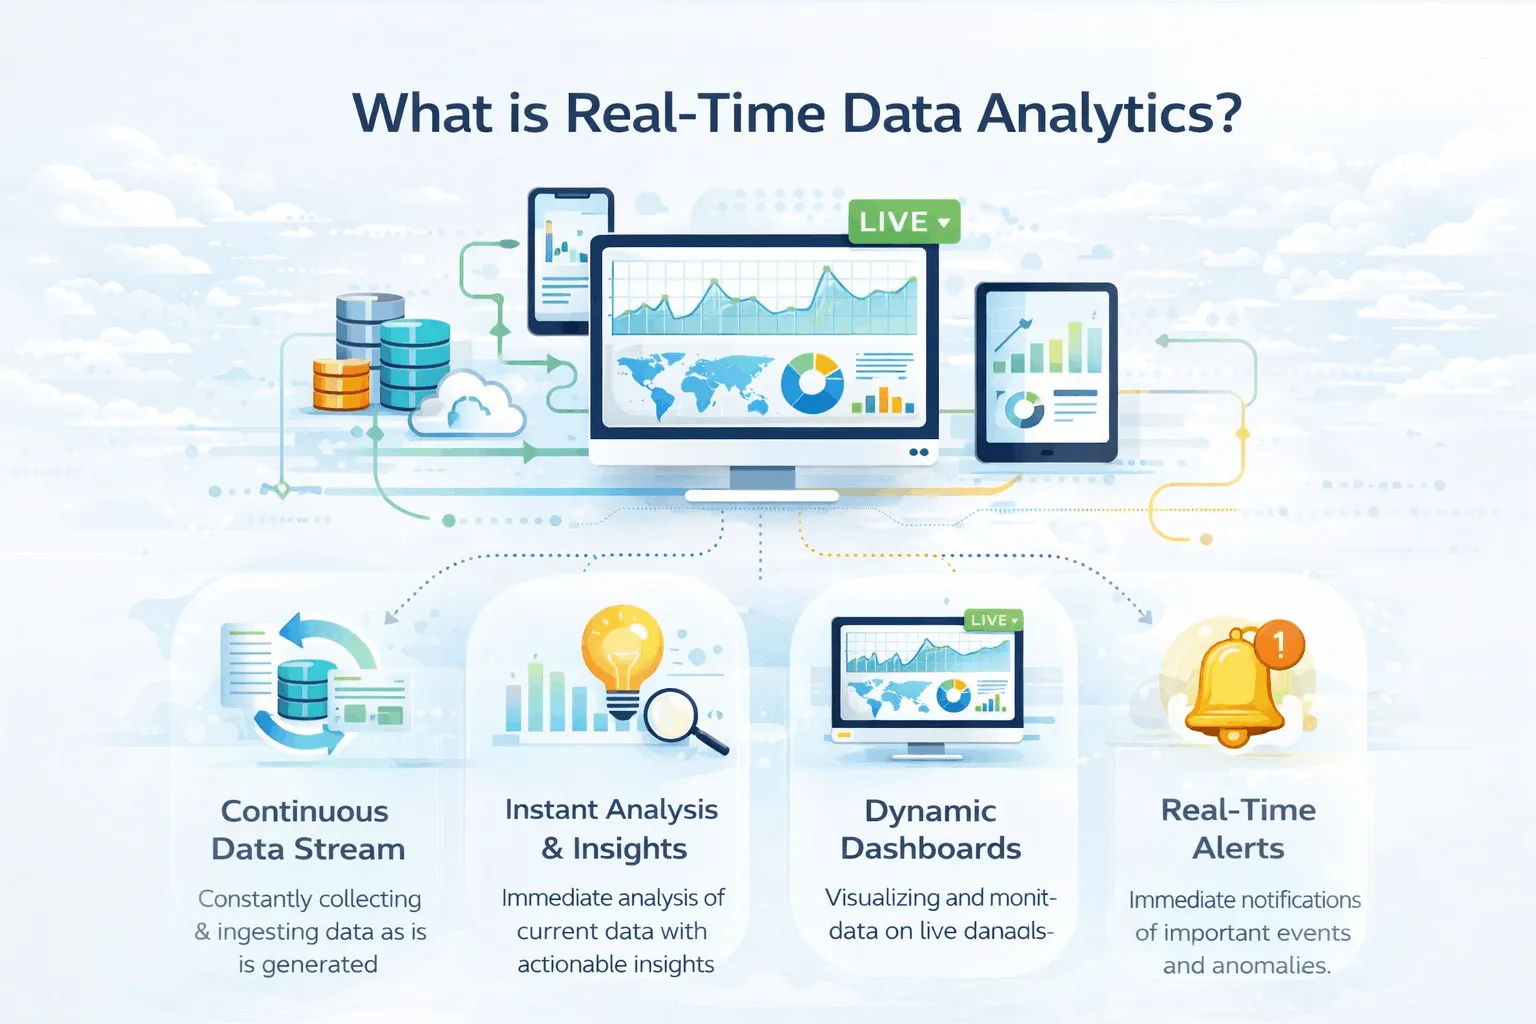
Illustration explaining real-time data analytics including continuous data streaming, instant insights, dynamic dashboards, and real-time alerts

Well, real-time analytics is a simple concept where you not only process your data in real time but also analyze it as soon as it is generated. This is a big advantage because you do not have to wait days to receive results from your data.

You also do not have to run a batch process to receive results from your data. Instead, you receive them in real time. You can even use them to power your data visualization services.

This is a significant advantage because you can rapidly improve your strategy.

Comparing Real -Time vs. Traditional Analytics 

Here is how using real-time analytics differs from traditional methods:

Aspect Traditional Batch Analytics Real-Time Analytics
Processing speed Hours or days Milliseconds to seconds
Decision timing After the fact While it’s happening
Data freshness Stale by the time you see it Always current
Typical use Historical reporting, trend analysis Fraud detection, live monitoring
Infrastructure Batch ETL jobs, data warehouses Streaming platforms, event processing

Key Benefits of Real-Time Data Analytics 


So, how can real-time
data analytics actually help scale your business?

The secret lies in its numerous benefits. These include:

  • Access to Instant Decision-Making 

As data is continuously analysed, you or your team can detect issues more easily. This leads to looking for both risks and opportunities as they occur.

Moreover, this also helps in emergency situations. For example, a fraud detection system is useless if it can’t detect it in milliseconds.

Get instant analytics from your data with streaming analytics solutions by Augmented Systems

  • Better Customer Experiences

Real-time analytics makes it much easier to detect buyer behavior. 

This means that a customer adding items to their cart can be instantly prompted with a discount.

  • Higher Operational Efficiency

Monitoring your business in real-time can help you fix issues as they occur.

Sensors can use real-time data analytics to predict failures. They can even schedule maintenance before failures happen.

  • Competitive Advantage 

It is always important to stay up to date with your competitors.

With this new method, you can optimize your pricing and launch media campaigns instantly.

To build faster streaming pipelines, teams often rely on ETL tools that support continuous ingestion and transformation.

Streaming Analytics Use Cases (By Industry)

Let us look at actual streaming analytics use cases observed across global sectors:

Industry Use Case How It Works
Financial Services Fraud detection Analyze transactions in milliseconds to block suspicious activity
E-Commerce Dynamic pricing Adjust prices based on demand and inventory
Healthcare Patient monitoring Stream vitals directly to alerting systems
Manufacturing Predictive maintenance Monitor equipment sensors to predict failures
Transportation Logistics Optimize routes based on current traffic
Media Personalization Serve personalized content recommendations

Implementation Strategy of a Real-Time Analytics Architecture

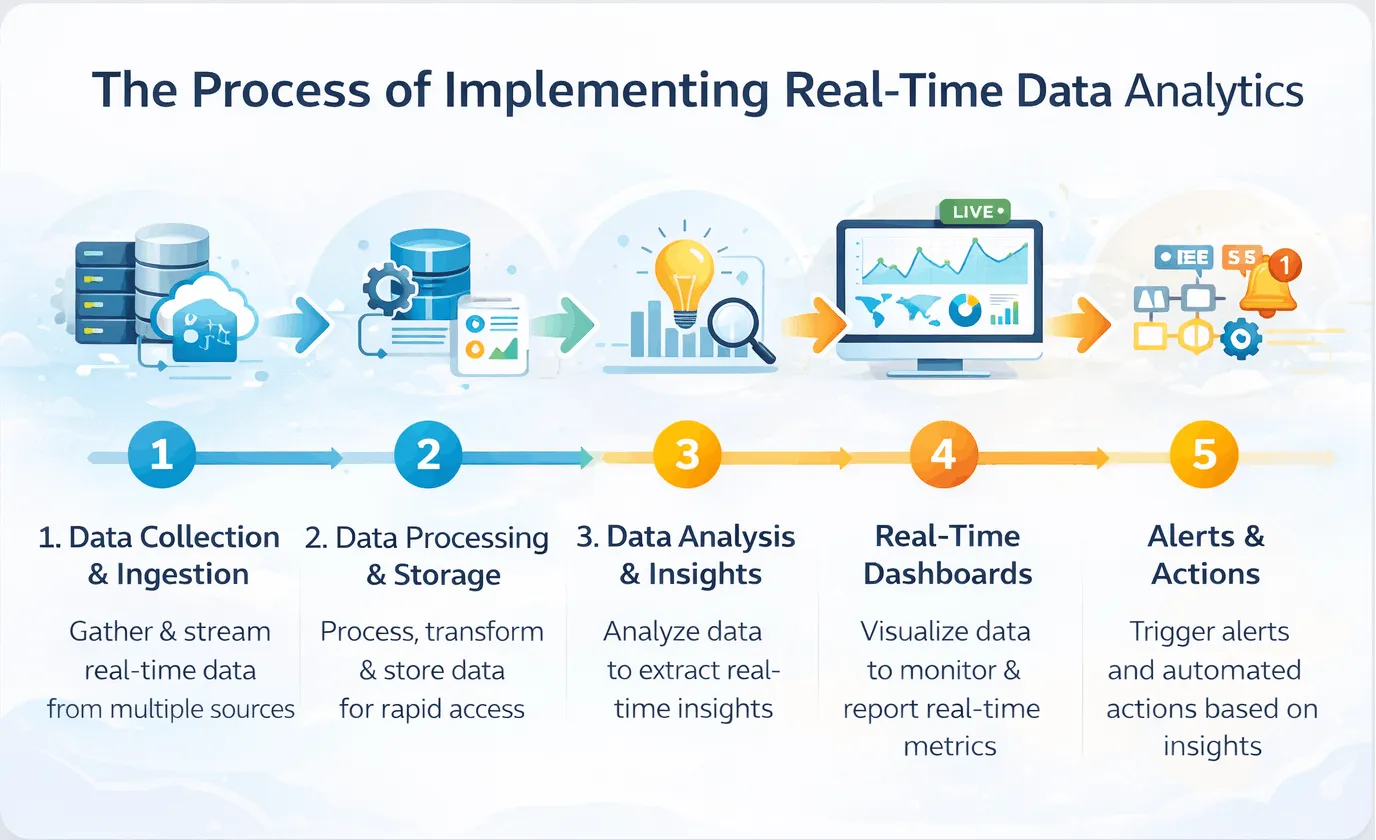
Step-by-step process of implementing real-time data analytics architecture including data collection, processing, analysis, dashboards, and alerts

Looking to implement a strong real-time analytics architecture? 

Ensure that you follow the steps I have mentioned below:

  • Identifying your best use cases

Never try to implement real-time analytics everywhere in your business.

Instead, consider prioritizing your needs. This means selecting high-priority use cases like:

  • Fraud detection if you work in finance 
  • Inventory sorting, if you are in retail
  • Monitoring equipment, if you are in manufacturing
  • Start With Change Data Capture (CDC)

CDC is a system that detects database changes and streams them straight to your central analytics system. This is the base foundation of any real-time pipeline.

Using CDC can help you detect changes in your business and reduce your overhead.

  • Building a Unique Streaming Pipeline 

You can easily design a pipeline for your business using these layers: 

  • Ingest (Capturing Data)
  • Buffer (Handling Throughput)
  • Process (Transforming data)
  • Serve (Loading data into dashboards)
  • Monitoring and Optimizing Data 

Real-time systems require continuous monitoring to function properly.

Such monitoring requires tracking latencies and error rates. You will also need real-time alerts for any data pipeline failures.

  • Iterate and Expand 

Successfully implemented your real-time data analytics system?

Now, it’s time to expand.

Continuously add more options to keep making your business easier to monitor and optimize.

A scalable streaming setup also depends on data migration frameworks that keep data movement reliable across systems.

Need real-time insights? Get expert data architecture consulting from Augmented Systems

Conclusion 

Real-time data analytics are not something you can consider as an option. Instead, it has become essential to survive in the current competitive market.

For the best results, I suggest that you partner up with a dedicated expert. I recommend choosing Augmented Systems for your needs.

We have a team of experts who can help you select appropriate tools and strategies for a successful implementation. They can also provide you with helpful data visualization services.

Moreover, our strategies can help you build real-time analytics. We help prioritize the exact use cases you need to tackle first. 

From architecture design to tool selection, the team at Augmented can handle every data challenge.

So are you ready to make your data work for you? Contact Augmented Systems today and get instant insights from your data.

Once live insights are available, using strong data visualization examples makes it easier to turn real-time signals into action.

FAQs 

1. What is real-time data analytics?

Real-time data analytics is the process of analyzing data as soon as it’s created, within milliseconds or seconds. Unlike traditional batch processing that runs daily or hourly, real-time analytics lets you act on insights while events are still happening.

2. What are common streaming analytics use cases?

Popular streaming analytics use cases include fraud detection in banking, dynamic pricing in e-commerce, patient monitoring in healthcare, predictive maintenance in manufacturing, and real-time logistics in transportation—any situation where immediate action matters benefits from real-time processing.

3. How does real-time analytics architecture work?

A modern real-time analytics architecture includes four layers: data ingestion (using tools like Kafka), stream processing (with Flink or Spark), storage (often in data lakes with Iceberg), and serving (via APIs or dashboards). This pipeline processes data continuously with sub-second latency.

4. What are the best real-time data analysis tools?

Leading real-time data analysis tools include Apache Kafka for streaming data, Apache Flink for processing, Tinybird for real-time APIs, and cloud services such as AWS Kinesis and Google Pub/Sub. The right choice depends on your infrastructure, team skills, and latency requirements.

5. What industries benefit most from real-time analytics?

Financial services use it for fraud detection, retail for dynamic pricing, healthcare for patient monitoring, manufacturing for predictive maintenance, and media for personalization. Any business that can act faster than its competitors gains a significant advantage.

Categories
Blog Data Analytics

Top 10 Data Cleaning Tools for 2026

Do you use data in your daily work life? Then you might already know just how frustrating and limiting messy data can be.

Over the years, multiple studies have shown that poor data quality results in trillions of dollars in wasted costs each year. This is a cost borne by global companies, resulting in time wastage and missed opportunities.

The solution? Organising your messy data using the right data cleaning tools.

Such data-cleaning tools can help you automatically identify and fix errors through their database services. They can accurately spot duplicates or outdated information.

Using such tools for data cleansing allows you to validate your emails and leads. It results in fewer errors and more accurate predictions & reports.

To help you in choosing the best data cleaning tools for your needs, I have created this detailed guide. It will walk you through the top data quality tools available in 2026 for your usage.

Whether it’s enterprise-grade solutions or free open source data cleaning tools, I have got you covered! Let’s dive in with a quick comparison.

Before comparing software options, it helps to understand data cleansing so you can match each tool to the right quality issue.

Quick Comparison: Top Data Cleaning Tools

Need just the basics to get started? Here is my complete list of the best data cleaning tools in 2026.

Tool Best For Key Strength Deployment
Informatica Cloud Data Quality Large enterprises Comprehensive data governance Cloud & On-premise
Ataccama ONE AI-powered automation Unified data trust platform Cloud & On-premise
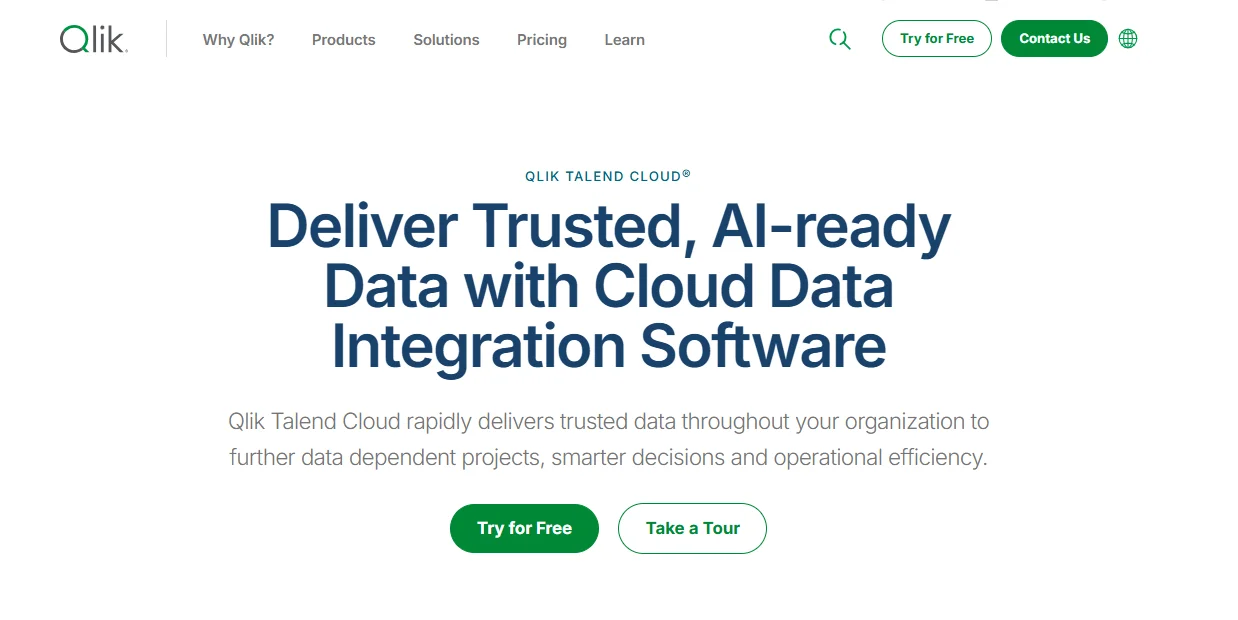
Qlik Talend Cloud Mid-market & technical teams Open-source flexibility Cloud
Precisely Data Integrity Enterprise data governance AI agents for data quality Cloud
AWS Glue DataBrew AWS users Visual data preparation Cloud
OpenRefine Small teams & budgets Free, open-source power tool Desktop
Alteryx Analysts & data teams Visual data preparation Cloud & Desktop
Tibco Clarity Interactive data cleansing Visual discovery & profiling Cloud & On-premise
Oracle Enterprise Oracle shops Master data management On-premise
dbt Data modeling teams SQL-based transformations Cloud & Open-source

Top 10 Data Cleaning Tools for 2026

Here is a more detailed look at the best data cleansing tools: 

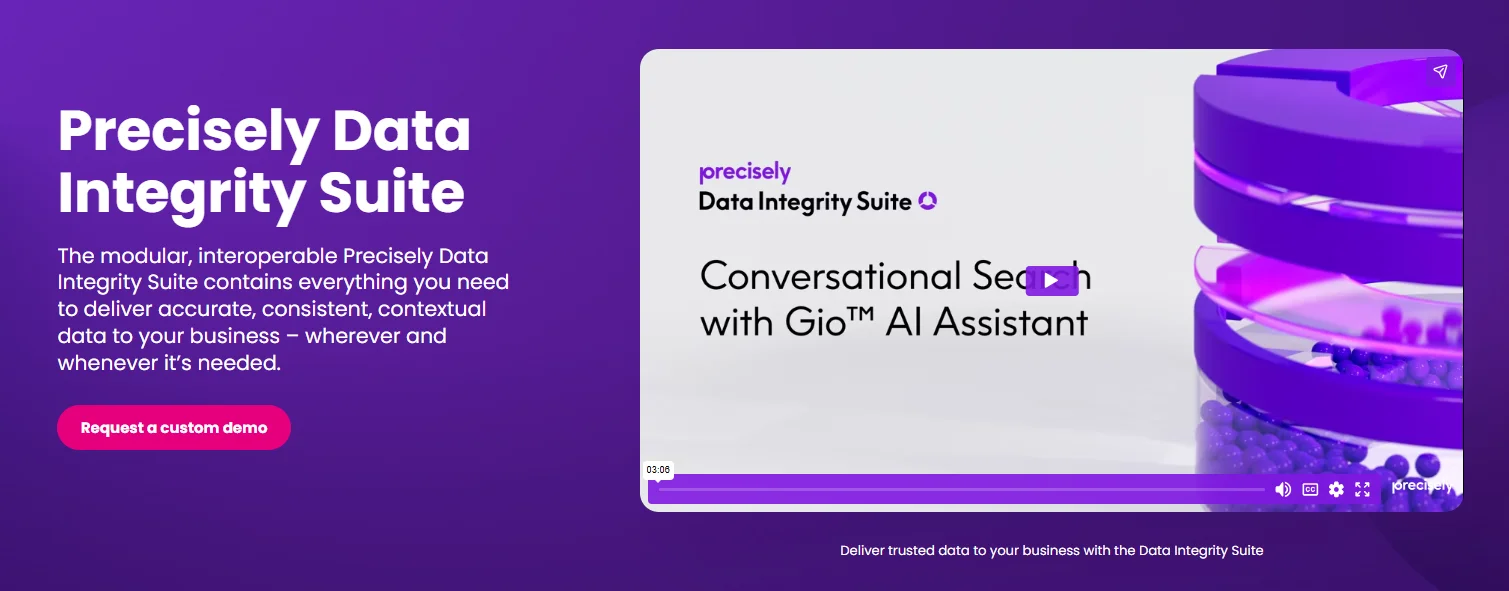
Precisely Data Integrity Suite

Precisely Data Integrity Suite data quality management software interface

Best For: Enterprises that require complete data governance

Precisely is known as a global leader for providing data integrity solutions. They are a trusted Fortune 100 company.

Their Data Integrity Suite is best suited for automating modern data workflows. Using new AI-powered agents, your data will always remain clean and ready to use.

Key Features:

  • AI agents for recommending and creating rules
  • Automatically standardizing and normalizing data
  • Verification for addresses and geocoding

Informatica Data Quality

Informatica Data Quality platform for enterprise data quality management

Best For: Large enterprises

Acting as your complete data quality management software, Informatical provides comprehensive services. They offer a range of profiling tools and quality checks to ensure accurate, consistent data.

Informatical even has matching algorithms in place that work across multiple systems.

Key Features:

  • Data profiling across millions of records in its database
  • Master data management by creating a single source of truth
  • Matching duplicates even in fuzzy or mispelled variations

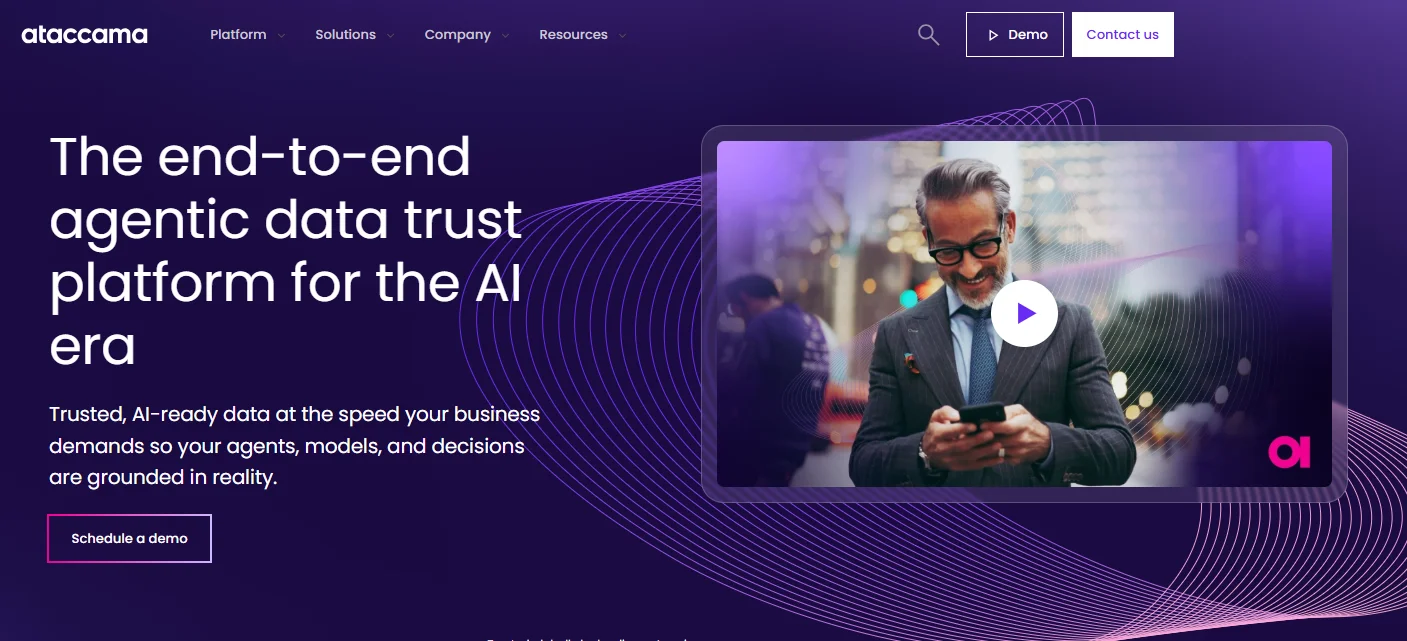
Ataccama ONE

Ataccama ONE AI-powered data quality and governance platform interface

Best for: AI-powered automation

Named as a Leader in the 2026 Gartner Magic Quadrant, Ataccama is an emerging modern solution. The platform is known for combining data quality tools with better governance under a single architecture.

Key Features:

  • Automating rule creation using AI agents
  • Unified platform for both data quality and governance
  • Transforms both structured and unstructured data

Qlik Talend Cloud 

Qlik Talend Cloud data integration and data quality platform interface

Best for: Mid-market companies

Using open-source flexibility, Qlik offers enterprise features at competitive prices. The platform combines both data integration and cleaning.

Key Features: 

  • Visualised workflow designer
  • Pre-built components for data quality
  • On-premise and cloud deployments

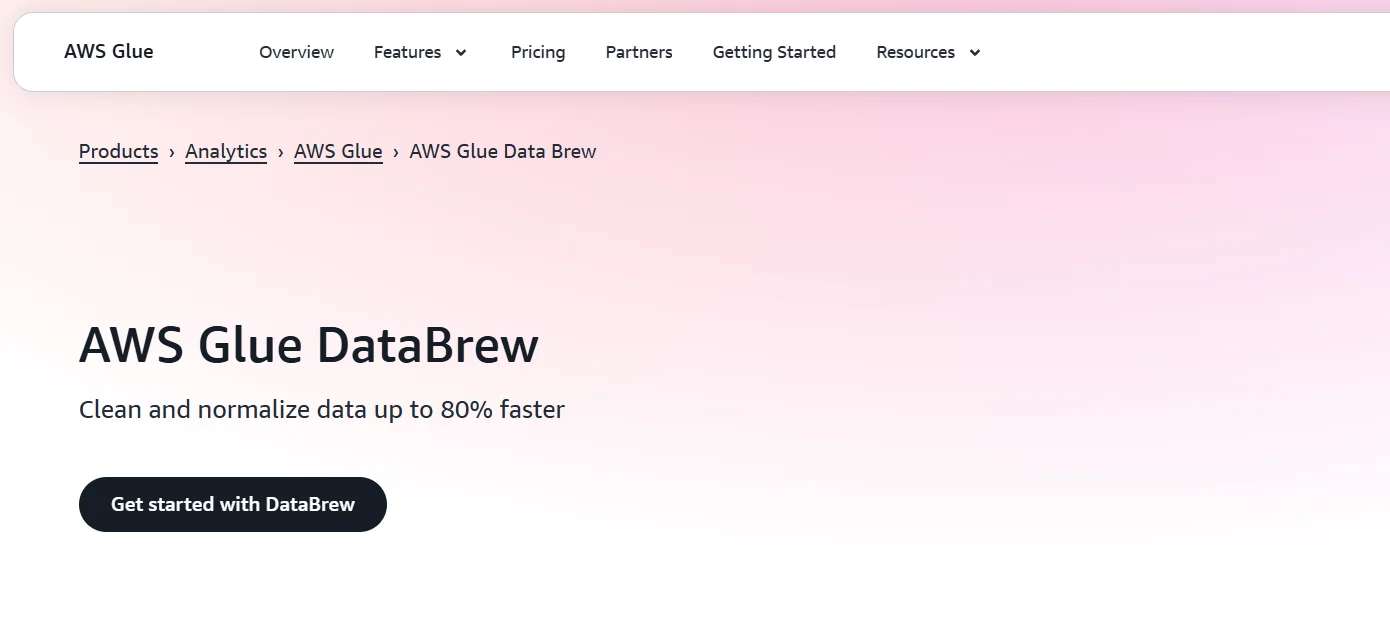
AWS Glue DataBrew

AWS Glue DataBrew visual data preparation and data cleaning tool interface

Best For: Organisations that are already using AWS services

One of the best visual data preparation tools you can use today is AWS Glue DataBrew. This tool provides a range of advanced features for data analysts to properly clean and normalize data.

You can use over 250 prebuilt transformations to make your daily data preparation tasks easier. It even supports automation features without writing a single line of code!

Key Features: 

  • Automated detection of data anomalies
  • Complex visual data profiling
  • Pay-as-you-go pricing structure

OpenRefine 

Best for: Small teams on tight budgets

OpenRefine is a free, powerful tool known for making it easy to handle messy data.

OpenRefine is an open-source data-cleaning tool that can run locally on your computer. This allows you to process your data offline and then shift it using any data migration tools.

Key Features:

  • Merging algorithms that help identify similar values
  • Pattern exploration using faceted browsing
  • Free software with undo/redo options

Alteryx Designer Cloud

Best For: Analysts and data teams

In need of visual data wrangling features? Then you should use Alterux.

Alteryx is well known for helping analysts convert messy datasets into easy functions. It can convert unstructured data into striking visual data analytics.

Key Features: 

  • Visual data profiling that clearly shows quality issues
  • Suggested transformations using machine learning
  • Easy-to-use interactive data preparation interface

Tibco Clarity

Best For: Interactive data cleaning

Tibco Clarity is a great option for those looking to make their data cleansing interactive.

It achieves this by using a visual interface that streamlines your data quality. Using Tibco, you can make your data discovery and data transformation easier than ever.

Key Features:

  • Cleansing and standardizing your data
  • Smart trend and pattern detection
  • Advanced rule-based validation of your data

Experian Data Quality 

Best For: Enterprise management of customer data

Experian offers enterprise-level data quality management software for organizations. You can use this to sort complex customer databases properly.

Key Features:

  • Real-time validation as you input the data
  • Batch data cleansing capabilities
  • Supports global address, email, and phone verification

dbt (data build tool)

Best for: SQL-based transformations

‘dbt’ is a unique tool that lets teams manage data modeling within their warehouse. It uses SQL and applies software engineering practices to optimize data pipelines.

The best part? It is one of the open-source data cleaning tools that is completely free!

Key Features:

  • Advanced SQL-based modeling with built-in testing
  • Automated documentation and data lineage
  • Completely free and open-sourced

For Microsoft-based reporting stacks, Power Query in Power BI is one of the most accessible options for everyday cleanup tasks.

How to Choose the Right Data Cleansing Tools

Confused between two or more tools for your data cleansing? Here is how you can make your decision easier.

Your Situation Best Tool Category Example
Large enterprise with multiple systems Enterprise data quality Informatica, Ataccama, Precisely
Small team with limited budget Open source OpenRefine
AWS cloud environment Cloud-native tools AWS Glue DataBrew
Need a visual, no-code interface Visual data prep Alteryx, Tibco Clarity
Oracle shop Oracle ecosystem Oracle EDQ

Conclusion

Choosing the right data quality tools is a very important step towards optimizing your organization. In this modern age, cleaning your data can turn it into a reliable asset.

Moreover, clean data can be the first step towards completing a major data project.

This could mean data migration to a new CRM or building a company-wide dashboard. But for that, you will require additional support from the right expert.

If you are planning such a large-scale data project, I recommend consulting our experts at Augmented Systems. They specialize in turning your data into your most valuable asset!

Our team consists of experts who can handle everything from data migration services to data quality implementation. They understand the dynamic challenges of cleaning data at scale and adapt accordingly.

When cleaning is part of a larger pipeline, ETL tools can automate transformation and delivery at scale.

Need help in choosing the right data strategy or cleaning platform? Feel free to contact Augmented Systems today to solve your queries easily!

FAQs

1. What are data cleaning tools, and why do I need them?

Data cleaning tools are software solutions that automatically identify and fix errors in your databases, such as duplicates, missing values, and incorrect formats. You need them because poor data quality costs businesses billions annually and wastes team time on bad information instead of productive work.

2. What are the best data cleaning tools for 2026?

The best data cleaning tools in 2026 include Informatica and Ataccama for enterprise needs, OpenRefine for free open-source cleaning, and dbt for SQL-based transformations. The right choice depends on your budget, team size, and specific data challenges.

3. What is the difference between data quality tools and data cleaning tools?

Data quality tools are a broader category that includes cleaning, but also covers data profiling, monitoring, governance, and enrichment. Data cleaning tools specifically focus on fixing existing errors, such as duplicates and data standardization. Most modern data quality management software includes cleaning as one of many features.

4. Are there good open-source data cleaning tools available?

Yes. Open-source data cleaning tools like OpenRefine offer powerful features for free. OpenRefine handles messy data with clustering algorithms and faceted browsing, running locally on your machine. For teams comfortable with code, Python libraries like Pandas and R’s tidyverse are excellent free options.

5. How do data cleaning tools fit into data migration services?

When you move data between systems, data migration services should always include cleaning as a critical step. Data preparation tools ensure your new system doesn’t inherit old problems, such as duplicates or inconsistent formats. Professional data migration services use these tools to validate and cleanse data before loading, protecting your new investment.