
Categories
Blog Data Visualization

What are the Best Data Visualization Components for Compelling Stories?

Every business today is trying to leverage the potential of data-driven decision-making.

And it’s easy to see why…data can fuel:

  • Tracking customer behavior and preferences
  • Identifying business opportunities and risks
  • Measuring sales performance and revenue trends
  • Optimizing operations and efficiencies
  • Enhancing marketing campaigns with real-time insights

And so much more!

But here’s the catch: Raw data isn’t alone enough. Without the right tools to visualize it, all your valuable data and its information remain hidden in spreadsheets and reports.

That’s where data visualization components come in!

The right charts, graphs, and interactive dashboards help you transform your complex data into clear and compelling stories. (Helping you and your team to make smarter decisions, faster.)

But with so many visualization options available, how do you know which components are important for crafting your powerful data story?

To help you out, I’ve rounded up the best data visualization components that will bring insights to your data.

(Remember, there is a visualization solution for every data need!)

Let’s jump in! 

Data Visualization Components: Table of Contents

  • What does Data Visualization Mean, and Why is it Important for Your Business?
  • What are the Key Data Visualization Components?
  • How Can You Make Data Visualization Effective?
  • Your Next Steps in Transforming Data Visualization with Augmented Systems
  • Data Visualization Components: FAQs

What does Data Visualization Mean, and Why is it Important for Your Business?

Imagine running a manufacturing business. You want to understand your sales trends over the last year. 

Would you rather:

1. Read a report with 10,000 rows of sales data broken down into regions, products, and time.

Or,

2. See a line graph showing how sales have increased or decreased over the last few months.

If you’re anything like me, you might go with option 2!

That’s exactly what data visualization does. It transforms complex data into beautiful pictorial representations, such as charts, graphs, heatmaps, and infographics, which make information easy to understand.

Why Does Data Visualization Matter?

In our experience, there are four major reasons why data visualization is critical to enterprises:

  1. We’re Wired for Visuals: Our brains process images 60,000 times faster than text. 
  2. Faster Decision-Making: Charts and graphs help you spot trends and patterns easily and help you make better decisions.
  3. Better Communication: Data visualization makes it easier for you to share insights with your teams, clients, and stakeholders.
  4. More Engaging and Impactful: Visuals grab attention, making them ideal for business reports, marketing presentations, and research findings. 

Regardless of the field you’re working in, data visualization makes information easy to grasp and understand. It helps businesses track sales, healthcare workers monitor patient trends, and governments map population changes.

So whether you are analyzing budgets, measuring marketing success or spotting patterns, good visuals are a must!

But the real question is, how can you visualize data effectively?

To be honest, it’s not about picking up a random chart or graph. It’s about choosing the right way to present your data so that it’s clear, useful, and easy to act on.

So, let’s break it down and see how you can do it the right way!

What are the Key Data Visualization Components?

Think about the last great movie you watched. What components made it great? 

It had a purpose, a great story, strong characters, and an engaging design, i.e., visuals!

Good data visualization follows the same format. It needs a clear goal, a compelling narrative, accurate data, and a smart design. 

When you miss any of these key data visualization components, your visualization falls flat! But when done right, your data will speak for itself.

So, let’s quickly examine four key components that distinguish a forgettable chart from one that makes people stop and pay attention.

1. Purpose

Before you start creating your visualizations, ask yourself: What message do I want to convey? Or What insights do I need from this data?

In my experience, every effective data visualization starts with a clear goal. Without a clear purpose, your data risks becoming just another set of numbers that people glance at and forget. 

Think about what you’re trying to accomplish: 

What’s the Goal of Your Data Visualization?

  • Are you highlighting a trend?
  • Are you comparing numbers?
  • Are you telling a success story?

A clear purpose makes sure that your visualizations drive real business results rather than just displaying numbers. 

2. Story

Now that you have a purpose for your visualization, the next question you need to ask yourself is: What story does your data want to tell?

Think about it this way. Your company wants to understand if happy customers really bring in more money. 

You’ve got two spreadsheets with separate reports: One with customer ratings and another with sales numbers. 

When you look at them separately, they won’t reveal much. But when you put both the reports, say, in a scatter plot, you can see a clear pattern: higher customer satisfaction leads to higher sales and more revenue.

That’s the power of storytelling in data visualization. 

What Should a Great Data Story Show?

  • Highlight the key insights: What’s the important takeaway?
  • Show relationships and patterns: How do different data points connect?
  • Lead to a clear conclusion: What action should people take?

For example, instead of just listing monthly sales figures, show how sales have grown over time or what caused the increase in sales. That way, your data won’t be just information, but it would actually make sense. 

3. Accurate and Relevant Data

Let’s say you are trying to compare online vs in-store sales. 

You pull the data, create a beautiful chart, and present it to your team. 

But there’s a problem…someone accidentally included last year’s numbers with this year’s numbers.

Now, your chart shows a fake sale surge that doesn’t actually exist. Or worse, it makes it look like sales are dropping when they’re not.

That’s why accurate and relevant data is everything in data visualization. No matter how eye-catching your graphs look, if your data isn’t correct, the insights won’t matter. 

How to Keep Your Data Clean and Meaningful?

  • Avoid outdated and incomplete data
  • Eliminate unnecessary information
  • Ensure consistency across sources

Pro Tip: Always double-check your data before visualizing it. Even a small mistake, like swapping rows in a spreadsheet or using the wrong data range, can completely change how people interpret your information.

4. Smart Design Choices

How would you feel looking at a dashboard packed with tiny text, clashing colors, and overlapping graphs?

In my experience, readers often get frustrated when they come across visuals that are too vibrant and distracting.

For the same reasons, designs matter in data visualization. Even the most accurate data and visualizations can lose their impact if it’s cluttered, confusing, or hard to read. 

How to Make Your Visualizations Clear and Effective?

  • Use contrasting colors 
  • Highlight key trends with distinctive colors
  • Keep labels clear
  • Use bold text wherever needed
  • Do not overwhelm the audience with extra elements
  • Use simple fonts, clean layouts and enough spacing 

Your goal should be a clear and easy-to-read visualization that delivers insights instantly, such that your audience gets the message without any guesswork. 

How Can You Make Data Visualization Effective?

Still not sure how to improve your data visualization? No problem. I’ve some data visualization best practices that can help you make the most of your data.

As we explored the different essential data visualization components, one thing became clear: even with the right elements in place, a visualization can still fail to make an impact if not executed effectively.

It should not be cluttered or confusing and should definitely NOT guide your audience from the key takeaways.

Thus, to truly make an impact, you need to fine-tune every detail.

What are the Best Practices for Data Visualization? How to Get it Right?

  1. Use Clear Headings and Labels: Your audience should instantly understand what they are looking at. A simple, well-placed title can make all the difference.
  2. Simplify Complex Data: Less is more. So, do not overload your visuals with too much information.
  3. Highlight Key Insights: Draw your audience’s attention to the most important trends with bold colors, callouts, or annotations. If a number stands out, make sure it’s impossible to miss!
  4. Select the Right Chart Type: Pick visuals that match your data’s purpose:

    a. Heatmaps for patterns and analysis

    b. Pie charts for proportions

    c. Bar charts of comparison

    d. Line charts for trends over time


  5. Make it Visually Appealing: Use contrasting colors, icons, and spacing to create a clean and professional look.
  6. Utilize Interactive Visualizations: Static charts provide just a snapshot. But tools like Tableau, Power BI, and Google Data Studio let their users explore data dynamically, leading to deeper insights. 

When data is right, data visualization won’t just display your numbers but give it a whole different meaning. A well-designed visual tells a story, highlights trends, and leads to better decisions. 

So, before you hit “Publish” on your next report or dashboard, ask yourself: is my data telling the right story in the clearest possible way?

Your Next Steps in Transforming Data Visualization with Augmented Systems

Now that you know what makes a great data visualization, it’s time to make it happen! But what if you could do it faster, with less effort, and get better results?

That’s where our data visualization consultants and experts at Augmented Systems can help you! 

We specialize in data visualization, analytics and BI solutions, helping you turn your complex data into real decision-making visuals. At Augmented Systems, our data visualization philosophy is driven by four elements:

Purpose. Story. Accuracy. And Clarity.

So, if you need a reliable data visualization consultant, why not connect with us for a commitment-free consultation? Our experts will work with you to convert your vision into actionable visualizations for vibrant results!

Data Visualization Components: FAQs

1. How do I choose the right data migration tool for my business?

Choosing the right data visualization tool depends on your data needs, technical experience, and business goals. We would recommend that you consider factors such as ease of use, integration with existing systems and scalability options before selecting a tool. 

2. What are the biggest challenges in implementing data visualization?

Some common challenges in implementing data visualization include data quality issues, integration complexities, and the learning curve for new tools. 

3. How does Augmented help enhance traditional data visualization?

We use AI and machine learning to automate data analysis, detect patterns, and provide predictive insights. Automation helps reduce manual efforts, minimizes human errors, and allows you to gain deeper insights faster. Plus, if you are a non-technical user, you can also interact more intuitively with your data.

4. What industries benefit the most from data visualization?

Almost every industry can benefit from data visualization, including finance, healthcare, retail, manufacturing and marketing
Categories
Blog Data Migration

Future of Data Migration Systems: Trends and Innovations You Can’t-Miss

The world is more interconnected than ever – especially with businesses constantly expanding and evolving.

The amount of data generated grows exponentially with growing businesses and organizations. Thus emphasizing the importance of comprehending the forthcoming trends of data migration systems.

The global data migration market is projected to reach $10.98 billion by 2025 at a CAGR (Compound annual growth rate) of 18.37% from 2020 to 2026.

So, let’s get on the bandwagon and look at the latest efficient and seamless data migration trends and innovations in this blog that you must take advantage of.

A Glimpse Into the Future Landscape of Data Migration

Before heading to the future, let’s first have a brief overview of what is data migration system.

What is Data Migration?

Data migration is a process of transferring data from one location to another. This includes transferring information from one database, storage system, or application to another.

It may sound like a simple process, but it isn’t that simple.

The data migration process has its own set of challenges. Additionally, it needs proper pre-planning and preparation before initiating the actual migration.

A Glimpse Into the Future

Over the years, data migration processes have seen a remarkable transformation. At first, data migration systems were only about manual entries. It was time-consuming and involved a substantial amount of errors.

Thankfully, digital transformation has brought a fundamental shift to the data migration processes and systems.

However, data is the new currency now. As companies and organizations grow with the ever-advancing world – the data and its value increase proportionally.

Statista states that the global data creation is forecasted to exceed 180 zettabytes by 2026. It’s difficult to even imagine processing such as large amount of data.

So let’s have a look and get updated with the latest data migration trends.

Data Migration: Top 8 Trends and Innovations You Cannot Miss

With the continuous expansion of data, data migration processes are getting more intricate.

So, to help you plan your company’s data migration process, we have compiled some latest trends and innovations to assist you in planning your company’s data migration process.

Let’s get started.

  1. Artificial Intelligence and Machine Learning

Artificial Intelligence (AI) and Machine Learning will be the cornerstones of data migration software. AI-powered tools will help automate many data migration processes in the coming years.

What Benefits Will AI and Machine Learning Offer?

  • Data migration companies can offer personalized services tailored to individual requirements using artificial intelligence.
  • Moreover, the AI and machine learning algorithms will help improve the efficiency and accuracy of data migration.
  • Businesses and organizations can eliminate the need for manual labor. This will minimize potential errors and lead to significant cost savings.

2. Extended Reality (XR)

It’s worth exploring how (XR) extended reality, which includes virtual reality (VR), mixed reality (MR), and augmented reality (AR) can play an influential role as a new trend in data migration processes.

What Benefits Will Extended Reality (XR) Offer?

  • Businesses can use virtual reality to practice and improve their data migration procedures using virtual environments that simulate real-world data migration plans.
  • Team members of a company can use AR and VR to facilitate remote collaborations during data migration.
  • They can use AR glasses to provide real-time assistance. Team members can also virtually immerse into dashboards to provide intuitive insights into data migration processes.

3. Improved Planning and Governance

With an increase in cloud adoption and data migration, data migration companies will need to seriously consider how to safeguard their data and client information.

Data governance and planning should be of utmost importance as organizations and businesses deal with large volumes of data.

What Benefits Will Improved Planning and Governance Offer?

  • It will reduce the chances of data loss, downtime, and disruptions during migration.
  • It would also ensure that data migration processes adhere to the legal guidelines and regulatory requirements.
  • Planning and governance will document the entire data migration process. This will serve as a valuable resource for future data migrations.

4. Data Quality and Accuracy

Data is the backbone of any business, so businesses and organizations need to prioritize the quality and accuracy of their data.

What Benefits Will the Quality and Accuracy of Data Offer?

  • Continuous monitoring of data post-migration and quality checks will ensure data reliability, integrity, and overall quality in the long run.
  • Moreover, it will improve the all-around quality of the data migration process.
  • With data accuracy, organizations and businesses can identify areas of improvement. They will be able to streamline operations and enhance overall efficiency.

5. Cloud-to-cloud Migration

Cloud-to-cloud migration is emerging as a new trend in data migration. Companies and businesses are utilizing services from multiple cloud providers.

It facilitates a seamless movement of data and information between cloud-based platforms.

What Benefits Will Cloud-to-Cloud Migration Offer?

  • Cloud-to-cloud migration will help you facilitate seamless transitions, prevent vendor lock-ins, and optimize costs.
  • It will help ensure that sensitive data is secured as well as it follows regulatory compliance during migration.
  • It would also allow you to choose a suitable data migration company without being constrained by a specific firm or their data migration plan.

6. Cybersecurity

The significance of strong cybersecurity measures cannot be emphasized enough with the current pace of digital transformations. The threat of cyber-attacks and malpractices expands with more devices, networks, and data.

What Benefits Will Better Cybersecurity Offer?

  • Future innovations will include AI-driven threat detection, decentralized identification management, and advanced encryption methods.
  • Sensitive data will be handled with utmost confidentiality, security, and sensitivity.
  • With more promising cybersecurity, cybercriminals or unauthorized users won’t be able to tamper with data during migration.

7. Blockchain

Blockchain is a decentralized register that is used to record transactions across a network of computers. For businesses, it uses a shared and unchangeable ledger that can be accessed only by members with permission.

Blockchain is an emerging solution for data migration systems as it addresses data security and enhances its traceability.

What Benefits Will Blockchain Offer?

  • It will help organizations create an immutable ledger, allowing them to track the origin and movement of data throughout the data migration process or lifecycle.
  • This will also provide a seamless data flow between diverse systems and data migration software.
  • As blockchain helps establish ownership of data, the user will be able to have greater control over their data and the migration process.

8. Collaborative Data Migration Platforms

With complex data migration processes, there might be possibilities when diverse teams would want to collaborate.

Collaborative data migration platforms will allow IT professionals, data scientists, data analysts, and team members to communicate seamlessly.

What Benefits Will Collaborative Data Migration Platforms Offer?

  • Throughout the data migration process, these collaborative platforms provide a centralized hub for workflow management.
  • Streamlining the data migration process will help team members to reduce the communication gaps.
  • Collaborative platforms will provide transparency, helping team members to track the migration progress. The clarity enables prompt identification of any issues that may arise during migration.

Conclusion

Adapting to modern technology has become a mandate as we move closer to the tech-infused future. With data migration, businesses can stay competitive and in the loop of the latest trends.

Even you can harness the power of exciting possibilities in the brimming technological world. All you need to do is stay updated with the growing trends and innovations.

With definite enhancements in the data migration software and systems, we at Augmented Systems will keep you and your organization updated. For more information and services, feel free to contact us.

Categories
Accounting Services Blog

Taking the Leap: Outsourcing Accounting Services in Australia for Maximum Efficiency

Finance plays a crucial role in every business, be it a startup or a multi-million dollar corporation. Nobody, especially entrepreneurs wants to face the nightmares of a financial crisis.

Over the past few decades, the role of accountants has grown. Especially in countries like Australia; where the accounting industry faces critical skill shortages and the ability to draw levels to the market trends.

This is where accounting outsourcing comes in!

Accounting and bookkeeping services help handle day-to-day business operations like employees – giving you and your business time to breathe and focus on what’s necessary.

So, let’s dive into this blog to learn more about the hows and whys of accounting outsourcing in Australia.

Why Businesses in Australia Should Outsource Their Accounting Services?

The two most crucial elements of running a successful business are – reducing costs and enhancing efficiency. For most large organizations, outsourcing helps them tick these two boxes.

1. Company’s Growth:

Accounting and bookkeeping services help businesses focus on what’s important. By working with accounting consultants and services, you can redefine your role and keep your business running smoothly. 

According to a report by Research And Markets, the global accounting services market is predicted to reach $735.94 billion in 2026 at a compound annual growth rate (CAGR) of 6%.

So, as a business owner, you can now focus more on your business and clients. Thus, outsourcing services will help you manage payables or receivables and maintain records.

2. Keeping Tabs on Accounting:

Keeping track of how well your business is doing is of utmost importance. You might not be available 24/7 and 365 days to check or create accurate financing reports. Of course, an in-house accounting team can help, but it can be expensive for a company.

This is when accounting and bookkeeping services professionally help you with your finances. They will regularly update you on your financial operations and help you analyze market trends.

Accounting Outsourcing for Australian businesses can be a game-changer. So, let’s discover the key benefits that help you save time and money while enhancing your financial management. 

Key Advantages of Outsourcing Accounting Services in Australia

The benefits of outsourcing accounting services or hiring an accounting consultant are endless. According to AFR, companies in Australia are paying 25-50% less per employee by outsourcing accounting services offshore. 

Here are the top five benefits of accounting outsourcing:

  1. Cost Efficiency

Outsourcing accounting services is highly cost-effective for businesses.

Save Time and Money: Skilled professionals help you save time and money. You can delegate them the repetitive tax return processing, bookkeeping, or verifying compliance documents and certificates.

Discretionary Expenses: When you hire a full-time employee for accounting, you will need to spend on salary, tax, office equipment, and more.

Fixed Rate and Hours: For an outsourced accounting company, you only need to pay for their accounting services or accounting consultations. Moreover, they often operate on an hourly rate or a fixed fee.

Overall, your business gets better control over your budget when accounting outsourcing in Australia. 

2. Focus on the Main Business

As discussed above, accounting outsourcing allows you and your business to concentrate on core activities and make strategic goal plans.  

The management team can direct their vision toward business development, customer service, client interactions, and overall operations. 

You can create a solid roadmap for your company’s financial growth when you let your employees do what they do best and outsource the rest.

3. Specialized Skillset and Expertise

Managing accounting processes can be a task. Even with the latest tools and technology at your disposal, you need an expert to run the accounting team and manage the clunky process.

You can easily navigate your accounting process with the right support and expert assistance. Moreover, your in-house accounting team can be expensive. 

So don’t let accounting become a burden – get the help you need to streamline your operations and achieve success. 

4. Flexibility and Scalability

Companies may scale up or experience a dip in business activities, especially if it’s a seasonal business or has fluctuating workloads.

If your company scales, every department grows, particularly accounting. Your payables and receivables reach numbers that you may have never handled before. By default, you will need to hire more employees.

On the other hand, if your company experiences a sudden plunge in your business activity, you might need to scale down your employees to manage finances.

To manage a company single-handedly can be overwhelming. Juggling between employees, finances, and company security requires much effort. 

If you outsource, a sudden scale-up or down won’t be an issue, as accounting outsourcing companies can manage the accounts depending on the current needs. 

5. Risk Management and Compliance

There is no denying the fact that fraud may occur. Your business and finances are always at risk. Even in-house accounting departments are not immune to internal fraud.

However, accounting outsourcing services can significantly reduce the risk of security breaches, data theft, and other fraudulent activities.

Accounting Regulations: Accounting outsourcing companies are well-versed in local and international accounting regulations. So, you can rest assured that your company is in safe hands when outsourcing.

Error Risks: The local and international accounting regulations help reduce the risk of errors or non-compliance penalties for businesses. 

Market Reputation: The outsourcing agencies will not do anything that would hamper its reputation in the market. 

Things to Consider Before Outsourcing

Every coin has two sides. While accounting outsourcing can offer several benefits, it’s always best to consider potential drawbacks. So before you dive in, consider these four points. 

1. Data Security and Privacy

Do not forget that you are sharing all of your and your client’s sensitive financial information, like bank account details, transactions, and more, with a third party.

Ensure that the accounting outsourcing company you hire meets all security standards and requirements. It would help if you kept a tab on data breaches, privacy and security, and the risk of unthaurized access.

Tip: Before hiring an accounting company, understand how their team will work on security compliance. You can ask them what measures they will take to prevent security breaches.

2. Quality

Quality over quantity. You are giving the most crucial part, i.e., handling your business’s finances, to a third party to handle. So, never compromise on the quality of accounting and bookkeeping services for your business. 

Of course, outsourcing companies provide experienced and professional experts. However, knowing their qualifications and experiences is never a loss. 

Tip: Choose an accounting outsourcing company that has hands-on experience with the services that your company needs. Do your research before you start working with one.

3. Communication

Communication is the key to any business. A two-way communication between you and the company you hired is pivotal. 

You may experience differences in time zones or language barriers, hindering the overall process. So, it’s always a good option to have clarity about everything and anything via communication. 

Tip: You can use well-trusted communication channels like emails or other third-party apps. Schedule regular meetings to keep track of work and receive updates on assigned tasks also helps create good communication.

4. Cost Transparency

While accounting outsourcing can be cost-effective, there can always be hidden costs. 

The hidden charges for providing accounting services may include additional fees for extra services or charges for hiring more accountants. These hidden charges might not be discussed or neglected when signing a contract. 

Tip: Always read the contract thoroughly before signing it. Remember not to skip pages and pay close attention to the hidden clauses. 

Conclusion

Accounting outsourcing services have now become a necessity in the ever-evolving business landscape. Companies providing Outsourced accounting services can be a game-changer in enhancing your financial management.

If you need one, we at Augmented Systems provide accounting outsourcing in Australia. You can find a trusted partner in us, as we provide quality work securely and efficiently.

Many Australian companies trust us with their accounting needs. So, be the ‘pathbreaker’ for your company and contact us for services, including payroll, bookkeeping, taxation, and much more.

Categories
Blog Cloud

Mastering Cloud Migration: How Top Services Ensure a Smooth Transition

Managing data and operations is a common business headache. It’s a dilemma, especially with today’s rapidly evolving technological landscape. 

Indeed, we all feel the frustration of wanting to access vital business information from anywhere. Moreover, accessing it without worrying about data security is also a task. 

So, is there a solution? Yes! 

Cloud Migration is your gateway to transformation. However, it’s not as simple as flicking a switch. It’s a strategic move that requires careful planning and execution. 

But worry not! This blog explores various cloud migration services that can help you achieve a seamless and successful migration journey. 

Let’s get started!

What Is Cloud Migration and Why Transition?

Cloud migration is a process of moving applications, data, and IT processes from an on-premise infrastructure to cloud-based services.

If you are seeking to break free from outdated and less efficient systems, you must bid farewell to your aging legacy servers or unreliable firewall applications. Why? Because cloud migration can revolutionize the way your business operates.

Using cloud migration services, you can store customer orders and track inventory. Secondly, you can effortlessly scale up your business during busy hours via online platforms. You can also ensure a seamless customer experience, save money, and focus on your business instead of managing complex in-house servers.

Cloud computing is here to stay as cloud migration services offer alluring benefits, such as:

  • Enhanced Efficiency and flexibility
  • Reduced operational costs
  • Improved Scalability
  • Enhanced Security

Despite all the benefits, proper planning and execution are crucial when it comes to cloud data migration. Failing to address these important steps can lead to significant risks and complexities.

So, to ensure a smooth transition, it is imperative to take careful consideration or even consult a cloud migration service provider. Let’s see how.

7 Best Practices You Can Use For Cloud Migration

Before migrating to the cloud, proper preparation and planning are crucial. You cannot simply jump into cloud data migration. Why? Simply because it poses several data migration challenges that can catch some off guard.

So, let’s have a look at seven best practices that you can use for a smooth transition to the cloud. 

1. Assessment and Planning

Before you start your migration journey, the most important step is to understand your business. A smooth transition starts with knowing how much data storage space your business needs.

Here’s how you can do that:

  • Evaluate your current It infrastructure, apps, and data. 
  • Identify potential roadblocks that may hinder your transition.
  • Find out the amount of data stored across all your computers and drives.
  • Sit back to decide if your data storage needs will increase, decrease, or stay the same shortly. 

Once your assessment is complete, move to the planning phase. Here, you need to identify and define your migration goals. Secondly, planning on which cloud migration solutions suit your needs.

2. Data Migration

Data migration is a crucial step when transferring data to the cloud. It ensures that your data is securely and accurately transferred. To maintain data integrity and data security during the transition, follow these steps:

  1. To prevent data loss, ensure to back up your data.
  2. Analyze and categorize your data based on data sensitivity, importance, and regulatory compliances. 
  3. Use data migration services or consult cloud migration service providers. 
  4. Make a plan that outlines the steps, timelines, and responsibilities for each data migration.

3. Security and Compliance

First and foremost is securing your data when transitioning to the cloud. Your company could be at risk without data security.

How can you do that?

  • Leverage the built-in security features on your cloud data migration.
  • If you plan on going with a data migration service provider, learn how they will keep your network, data, and cloud connection secure.
  • Reliable IT support during and after the transition is crucial for a smooth and successful migration.
  • Ensure you have the necessary support to handle any potential challenges.
  • You can also secure your infrastructure using cloud provider tools, such as VPNs, firewalls, and intrusion detective systems.
  • Do not forget to ask your cloud provider to give you the necessary compliance certificates.

4. Migration Strategies

This is a step where the actual migration takes place. It involves the actual transfer of data and applications. You can choose from a range of techniques for your data migration.

  • The lift-and-shift approach – Directly moving from on-premise servers to the cloud infrastructure without modifications.
  • Re-platforming (Lift, Tinker, and Shift) – Slight application or data modifications before transitioning to the cloud.
  • Refactoring/ Rearchitechting – Completely re-designing the on-premise data or application. 
  • Repurchasing (SaaS Adoption) – Repurchasing cloud-based software, where existing applications can be replaced with Software as a Service (Saas).
  • Retiring – The option to identify and remove legacy applications which is no longer required. 
  • Retaining – Retaining certain on-premise applications.

Based on the nature of your applications and the requirements of your business, you can choose from any of these techniques for your data migration services. 

5. Adoption and Optimization

Congratulations on successfully transferring your workload to the cloud! Now, it’s time to take the next step toward maximizing its potential. 

How can you do that? Simple by optimizing and adopting the cloud system. 

  • Adoption refers to adopting the new system. Provide training to your team about the new cloud-based tools and processes. You can offer training materials and sessions to educate the users. 
  • Optimization involves the persistent monitoring and improvement of resources to control costs effectively. It also refers to using cost savings tools provided by Augmented Systems which is a cloud migration service provider. 

6. Testing and Validation

Testing and validating procedures are crucial to ensure a smooth and successful migration process. Do not take any chances with your valuable data; take all the necessary steps to ensure a thriving transition. 

  • Additionally, religiously test your migrated data’s functionality, performance, and security. 
  • Address any issues by engaging end-users to provide feedback or performance concerns. 
  • Regularly review and update your testing and validation processes with the evolving business needs. 

7. Documentation

Establishing strong governance and management practices. It is important to maintain control and visibility over your cloud environment.

Moreover, document the entire migration process, including configurations, settings, and customizations made.

Do not leave anything to chance – document everything and create a comprehensive record of your migration process.

Top 7 Cloud Migration Tools 2023

As more organizations and businesses transition to the cloud, the need for robust cloud migration services and tools has never been more prominent. But, with countless providers to look over, it can be hard to decide where to begin. 

Here is a list of the top 7 Cloud Migration tools for 2023 to help you make the right decision.

  1. AvePoint – AvePoint provides cloud migration services from on-premises or cloud-hosted environments to SharePoint or Microsoft 365.
  2. Azure – Azure is a cloud computing platform by Microsoft that offers access, management and development of applications through Glodab data centers.
  3. AppDynamics This ensures the health and security of your applications. It rapidly recognizes issues so that they can be addressed immediately.
  4. Google Cloud – It offers services and solutions to help migrate your information and applications to the cloud data sets.
  5. Turbonomic – It monitors and streamlines responsibilities by offering a hybrid cloud automation platform. 
  6. Carbonite Migrate – It offers cloud migration services and solutions for professional use, enterprise, and home. 
  7. AWS Migration Tools – Amazon Web Services offers dependable migration services that migrate information without changing the source and objective.  

Conclusion 

In this digital era, businesses can unlock the cloud’s unprecedented opportunities and achieve sustained success. 

Companies can gain a competitive edge and drive growth like never before by leveraging the cloud’s full potential.

However, cloud migrations are not just about confining to the latest trends but aligning digital transformations with your business requirements. So, if you have any questions, you can always contact us.

Categories
Blog Data Visualization

Visualizing the Future: Trends and Innovations in Data Analysis

No wonder data is now an asset for companies across all industries. However, the abundance and complexity of data bring exciting yet challenging opportunities.

Amid the cut-through competition in the digital age, moving to a data-driven model is necessary. 

In this blog, we will discuss the emerging nature of data analysis. Moreover, the latest trends and innovations that you can use for your business. 

Let’s get started.

The Ever-Evolving Nature of Data Analysis

When gaining business insights, there was a time when businesses solely wanted answers to “What happened?”

A hypothetical scenario where a company’s sales sharply declined within the last quarter. The core focus was to know “what happened? to the sale…” However, several indicators after trying to find the what, it was “why it happened” that everyone was after.

Once the why was known, data analysis and visualization techniques further evolved.

But the human mind never halts! With the desire to look beyond the present and focus on the future, data analysis solutions grew.

According to Statista, the global data analytics market will boost with a compound annual growth rate of nearly 30% in the coming years. 

So, you can imagine the changing dynamics of data analysis with time. Right? Data analysis in conjunction with data visualization software, you can: 

  • Analyze your data
  • Make informed decisions
  • Predict the future behavior of your business 
  • Improve your overall business growth

So, excited to get started? But, with the advent of new technologies, you need your business to be more productive and follow today’s trends. Data analysis and visualization solutions come under those trends. 

Moreover, after the global pandemic, over 97% of organizations are investing in big data and artificial intelligence. 

So, let’s have a look at the top five trends and innovations in data analysis that you can use for your business or organization.

The Top Five Trends and Innovations of Data Analysis

Businesses today are willing to stay in the market and increase their odds of success. They are working with slimmer margins for errors. Companies are not taking risks or making decisions based on bad data. 

The sole reason? Today, data is considered the “new oil” of the market.

Here is why we are bringing you the top five trends and innovations that you can use to make better-informed decisions. Let’s dive in.

1. Artificial Intelligence and Machine Learning

With the ocean of data that organizations collect, more than 85% or more of data is unstructured data. Thus, companies and businesses are adopting artificial intelligence and machine learning to analyze big data.

AI and ML will allow you to structure your data in a smarter and faster way. These advanced analytics techniques allow you to predict better insights, automate your tasks, and provide improved decision-making solutions.

Example: The Banking Sector

The biggest sector using the power of AI and ML is the banking industry. Banks are getting a 360-degree view of their customer data to provide better digital experiences and data visualization with the aid of data scientists and visualization developers. 

However, almost every industry, from retail to manufacturing, is impacted by AI/ML. All are trying to convert their data into tangible assets. 

Moreover, the businesses not riding on this wave will risk losing ground to others.

2. Data-as-a-Service (DAAS)

Companies store data online, using Data-as-a-Service, a cloud-based management platform. Likewise, you can leverage the platform to update your company’s infrastructure, improve data visualization, streamline management, and enhance analytics.

Furthermore, an increasing number of businesses will adopt DaaS tools. The global DaaS market is projected to expand. 

This cost-effective cloud computing technology helps organizations to remotely access, manage, and analyze their data.

Example: 

A retail company willing to improve sales accuracy uses DaaS to access data sources, manage compliance, and scale operations. This helps them scale the requirements and adjust their operations to fluctuating demands.

3. Data Visualization

Data visualization software helps make complex and big datasets understandable and accessible. It helps transform complex data into clear and intuitive visuals. 

Data analysts use visualization applications and tools to gain insights into the data, identify patterns, and further analyze the data.

Example: The COVID-19 Dashboard

As you can see in the image above, Governments and health organizations worldwide use data visualization as a tool in data analysis. They used it to inform the public and better understand the pandemic.

Data visualization plays a crucial role in conveying complex data to the public and decision-makers. Data visualization helped the government understand the global crisis and make informed decisions. 

However, you don’t have to invest countless hours to plot those visualization graphs. Augmented Systems data visualization solution is a game-changer for businesses seeking deeper insights from their data.

4. Data-Driven Consumer Experience

Behind every business today, the driving force behind every decision is the customer’s needs and wants. Over the years, the customers’ expectations have increased.

Here is when data analysis comes into play. Organizations use data analysis to deliver personalized customer experience. They engage the target audience with their needs and expectations. 

According to the news from dimension data, 84% of companies that work to improve their customer experience report increased revenue.

Thus, most of the platforms nowadays use data analytics to provide personalized service to their customers. 

Example: E-Commerce Personalization 

You must be aware of e-commerce platforms, such as Amazon and Flipkart. These platforms provide personalized shopping experiences to the shoppers. 

Data analysis is used to analyze your past interactions with the platforms. The platform then tailors your choices and needs, providing a personalized shopping experience. 

5. Cloud-Based Database

The graph displays the rate of data created, consumed and stored from 2010 to 2024. Over the years, global data creation is projected to grow by over 180 zettabytes. 

It’s a task to gather, label, clean, and organize big data in one place. Thus, cloud-based platforms are becoming popular. Businesses can improve task management and efficiency by utilizing cloud-based data with future data science trends.

Example: Data Science Project Collaboration

For a data science team in a global corporation, with team members scattered across the world, cloud-based data analysis plays an important role.

Using cloud-based tools and platforms, data analysts, scientists, engineers and data visualization developers can work together. The data collected from various sources can be accessible to all team members.

Conclusion 

The data analytics market is expected to grow enormously, with a forecasted market value of over 650 billion dollars by 2029

So, imagine how these trends can help you shape your business with the help of data analysis. Making your business more powerful and efficient.

Moreover, you can stay competitive, make informed decisions, and create personalized customer experiences. Embrace these innovations and harness the full potential of our ADL analytics with us at Augmented.

Categories
Application Integration Blog

Smart Approach to Application Integration: Best Practices and Proven Strategies

Software has become a key part of modern businesses, and we need many of them to perform different business functions.

However, managing all of them can give you headaches daily. You don’t want to spend half of your day juggling, don’t you?

That’s where application integration comes in.

How do you ensure your business’ application integration is done to its full potential? Well, you read this blog post. 

Let us uncover the best practices and proven strategies so that you can best leverage application integration. Let’s dive in!

What is Application Integration? Why is It Important?

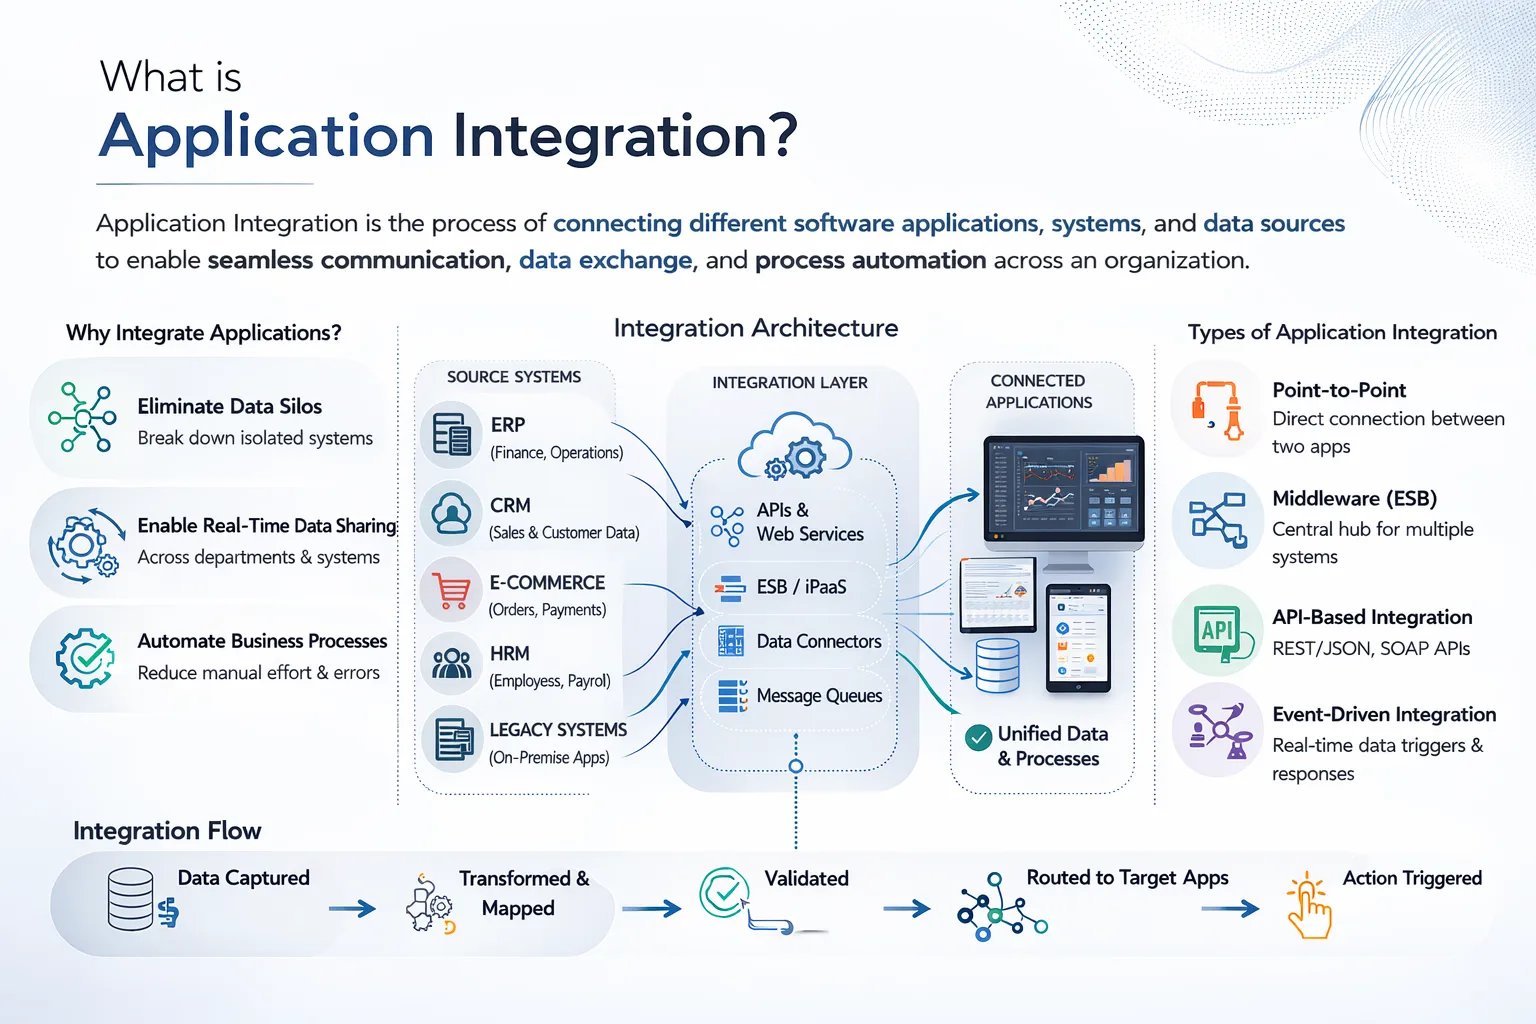
Application integration is a process of coinciding multiple applications through a common platform, enabling seamless communication and data sharing. 

Businesses these days rely on multiple applications to perform different tasks. All the application works in silos. Result? It leads to inefficient processes and errors. 

Application integration streamlines the tasks, reduces errors, and increases business and organization productivity. 

For instance, you buy clothes from an online store. What does integration of applications do? It helps the online clothing store to link their website, inventory management, and payment processing system.

When you order clothes from this online store, the website automatically updates the inventory and processes your payment. This assures that the entire process is seamless, without any hiccups. 

Inarguably, every application works great individually. However, the integration of applications plays a vital role in connecting the on-premise legacy systems with modern cloud-based enterprise applications.

In today’s tech landscape, integration is essential for optimizing organizational efficiency and reducing costs.

Benefits of Effective Application Integration Services

Application integration is a game-changer for businesses as they can streamline operations more efficiently, improve data flow, and enhance productivity.

Let’s dig deeper to know the five key benefits of application integration services.

Benefit 1: Information Sharing

As the name suggests, the application integration software has the ability to share real-time data between various software. It bridges the gap between different applications by ensuring consistency across your organization.

Example: Application Integration for a Retail Store

A retail store shares information between its e-commerce platform, inventory management system, and customer relationship management (CRM) software. How?

  • A customer places an order on the website. The website shares this information with the inventory system. It checks the stocks and provides real-time updates to the CRM system.
  • The CRM system updates the customers for delays or refunds. As well as it stores order history and preferences for recommendations.

Thus, with application integration, information sharing among these systems makes the process smooth, efficient, and customer-friendly.

Benefits 2: Process Automation

Integration of applications automates the entire process (as in the example above). It eliminates mundane data entry tasks by connecting different applications. Thus allowing employees to focus on value-added work.

The overall benefit of process automation is that it enhances efficiency and productivity for any organization.

Example: Application Integration for a Company’s HR System

Say a company wants to automate its employee onboarding process. Application integration helps the HR system collect employee details, set up payroll, and grant access to related systems. How?

  • So, when an employee gets hired, the automated HR system shares the information with the payroll system, IT system, facilities department, and more.
  • Payroll systems update salary-related details. The IT system creates a user account with necessary access permissions. The facility department arranges for desks and other equipment for the new employee.

Thus, process automation accelerates the onboarding process by enhancing efficiency and minimizing errors.

Benefit 3: Reduces Time and Saves Money

Application integration offers time savings and cost-saving advantages to an organization. It helps eliminate duplicate data and reduces operational costs. 

Automating workflow helps employees save from task redundancy and provides better data management. 

Example: Application Integration for a Small Business

Say a small business wants to grow its business by focusing more on customers. They do so by improving their sales and marketing. Application integration can help the business do so cost-effectively and in less time. How?

  • They integrate their CRM system with the marketing system. The CRM system updates customer information when a potential customer shows interest in a product or service.
  • The customer details are added to the list of sales leads. Which the marketing team looks at and automatically sends follow-ups to nurture the leads.

This reduces manual data entry, downsizing the dependency on manual work and lowering labor costs. 

Benefit 4: Accurate and Consistent Data

Manual data transfer from one system to another often leads to errors and inconsistencies. Of course, it’s natural. Human errors are prone to happen. Solution? Application Integration.

Application integration accurately and consistently exchanges information between applications with minimal risk of data discrepancies. 

Example: Application Integration for a Shipping Company

A shipping company integrates its order management and delivery tracking systems to ensure data consistency and accuracy. How? 

  • As a customer places an order for a shipment, the order management system shares customer and order details with the delivery tracking system. 
  • The delivery system does its tasks with the information and provides real-time updates to the customers. If there are changes to the delivery, the delivery system informs the order management system, which notifies the customers. 

With application integration, manual errors are eliminated, ensuring that the data shared over the systems is accurate and consistent. 

Benefit 5. Enhanced Customer Experience

Ensuring a satisfactory customer experience is essential to retaining customers and gaining a competitive edge in today’s market. No one would want to visit your organization’s platform if they had to open different applications for a single task. 

Streaming those applications together using application integration enhances customer experience. 

Example: Application Integration for a Clothing Website

A clothing website integrates with its inventory management system for an enhanced customer experience. How? 

  • On a website, when a customer selects a product, the website verifies its availability by checking the inventory system.
  • If the product is available, the customer may process to add it to the cart; otherwise, an “out of stock” message pops up on the website’s screen. After the purchase, the inventory system updates the stock on the website.

A positive customer experience increases customer satisfaction and loyalty.

Best Practices for Successful Application Integration

1. Research

You should know what you want to achieve. Doing proper research is like doing your homework before a project. For a successful application integration, gathering information is crucial.

So, ask these questions to yourself as you start your research. 

  • Integration Objective: Which integration approach is most suitable for your requirements? Which approach aligns best with your organization’s objective? 
  • Understanding of the System: Learn about the way the system works. Are you aware of its technical requirements?
  • Basics of Application Integration: What is API, and how do APIs work?
  • Resource Planning: What is your budget and timeline? Who are the stakeholders?
  • Effectiveness of the Integration: How will you measure the success of your integration, and what will be the challenges?

2. Application Integration Tools and Platforms

Familiarize yourself and experiment with various application integration tools. Why? Because you should know which tool suits your requirements or business needs. So, to work with an integration system, you need to gain practical knowledge and experience. 

These are a few application integration tools you can use – Boomi, Celigo, and IBM. Another solution is to hire an application integration expert.

3. Stay Updated

It would help if you connected with as many people as possible to stay updated with the latest technological trends and advances.

So, network with other professionals from similar fields, participate in workshops, and attend events. You can likewise attend webinars and conferences as well as follow industry blogs.

4. Data Quality and Security

To prevent errors and maintain reliable information, you need to ensure that the quality of your data is accurate and consistent. Moreover, the shared or integrated data with other applications should be securely transferred. 

5. Seek Feedback, Monitor and Test

Ask for feedback from mentors and industry experts. Use the feedback to implement necessary changes. 

Furthermore, use monitoring and error-handling mechanisms to detect the issues early, diagnose the problems and implement solutions.

Last Advice: Hire Application Integration Experts

In today’s swiftly changing digital domain, hiring an application development and integration expert is like hiring a tech-savvy magician for your business. They can be beneficial for several reasons.

  1. They Know What They’re Doing: The experts have in-depth integration knowledge. They know how to integrate various systems and applications. Moreover, they streamline the processes and help prevent costly errors. 
  2. Custom Solutions and Scalability: They assist you in tailoring the integrations according to your business requirements, guaranteeing progress and growth. 
  3. Quick Fixes and Security: The hallmarks of expert service: they quickly resolve issues and maintain data security as they’ve done hundreds of times.
  4. Compliance and Support: Experts ensure all connections comply with industry regulations and standards. They also provide continuous support and maintenance. 
  5. ROI Maximization and Strategic Insights: Integration experts offer value advice for staying competitive and optimizing technology investments. 

We at Augmented revolutionize the IT industry by simplifying and enhancing how businesses utilize technology. 

With over 15 years of industry experience, Augmented Systems has over 60 projects exceeding customers’ expectations. Moreover, more than 40 active clients rely on us for their IT needs. 

We are committed to providing exceptional quality, true leadership, and a nurturing collaborative environment. We take ownership and accountability seriously. 

You can trust us to uphold the highest standards of integrity and stay updated with the latest technological achievements. 

Final Words

In this digital era, where data flows freely and technology is evolving quickly, application integration is not merely a convenience but a necessity. Organizations worldwide have adopted it, and you should, too.

At Augmented Systems, our team of experts is dedicated to providing top-notch software development and application integration services. Unlock the full potential of your organization and contact us if you need help with your application integration needs.

Categories
Blog Data Migration

Top 10 Data Migration Challenges & Solutions

Given that you’re here, I bet you’re either planning a data migration, already dealing with it, or at least thinking about it!

Whatever the case, data migration sounds easy on the surface: Export, Import, and done

To be honest, that’s a myth! In reality, it’s a different ball game altogether. 

  • Corrupt files
  • Security risks
  • Downtime
  • Data loss
  • System crash

These are just a few of the challenges waiting for you! 

In the worst case, a failed migration could cost you time, money, critical business data and a system that doesn’t function as expected. 

Sounds like a nightmare, if you ask me! But don’t worry, I’ve got your back. 

I’ll walk you through the top 10 data migration challenges that you may encounter while migrating your data. I’ve also included solutions to overcome those challenges for a successful migration. 

Let’s get started. 

Data Migration Challenges: Table of Contents

  • 2026’s Top 10 Data Migration Challenges (and Their Solutions)
  • What are the Top 10 Data Migration Challenges, and How to Overcome Them?
  • Are You Ready to Migrate Your Data?
  • Data Migration Challenges: FAQs

What are the Top 10 Data Migration Challenges, and How to Overcome Them?

Imagine moving to a new home. You pack everything carefully, and when you arrive, you find that a few boxes are missing and fragile items are broken. Now you are stuck fixing problems that could have been avoided with better planning! 

The same is true of data migration. Without a proper strategy, data migration challenges could lead to serious disruptions, revenue loss and compliance risks

That’s why identifying data migration pitfalls early and having a solid migration plan is essential. 

Let’s address the common data migration problems and see how you can ensure that your migration goes off without a hitch. 

Data Migration Challenge #1: Loss of Data

One of the most significant data migration problem is the risk of data loss. Imagine losing your most important data, such as customer data, financial records, or key business reports. 

Data loss may lead to missed sales, unpaid invoices and even legal or compliance issues. Now, this can damage both your finances and your hard-earned reputation!

This can happen due to technical glitches, human errors, or compatibility issues between your source and target systems.

How to Prevent Data Loss During Migration? 

  • Perform an overall data backup before migration.
  • Conduct a test migration in a controlled environment to identify potential data loss risks.
  • Implement data validation checkpoints to ensure the accuracy of migrated data.

It is worth noting that losing even some of your most valuable data, you may lose your sales and jeopardize your entire business. 

Data Migration Challenge #2: Significantly Long System Downtime

Extended downtime during data migration can disrupt business operations. In turn, this can lead to productivity losses, dissatisfied customers, compliance issues, and a major blow to your reputation.

Imagine your systems being down for hours or even days due to data migration. 

What would happen? 

Your employees would be unable to access information, customers would face delays, and operations would come to a standstill. 

To prevent these disruptions, minimizing downtime is the key. 

How to Prevent Prolonged Downtime During Migration?

  • Plan the migration during quiet periods, i.e., off-peak hours, to minimize business disruptions.
  • Use an incremental migration approach to reduce downtime by moving your data in smaller batches.
  • Set up real-time monitoring to detect, realize, and resolve issues promptly before they scale. 

By taking these steps, you can keep your operations running smoothly and avoid costly downtime while you move your data from one location to another. 

Data Migration Challenge #3: Data Mapping Taking Longer Than You Thought

Data mapping is a critical process in data integration. Through this process, your company aims to align and transform data fields between different systems. 

It’s like translating a book into another language. That means every word, phrase and sentence structure needs to be manually adjusted to make sense. 

Now, if you have complex data structures, different formats and inconsistent models, the process becomes time-consuming and error-prone. Thus, manual intervention becomes necessary to resolve discrepancies. That means more delays and an increased risk of human errors.

How to Deal With Slow Data Mapping During Data Migration?

  • Use automated data mapping tools to expedite the process and reduce manual work.
  • Engage domain experts to ensure accurate data mapping.
  • Allocate sufficient time and resources for comprehensive data mapping.

Without careful mapping, you may lose the most important information or misinterpret the data, causing confusion and inefficiencies down the line. 

Data Migration Challenge #4: Data Governance Problems

Data governance is critical to data migration as it ensures data integrity, security, and compliance for the successful application of your data migration strategy. 

However, if policies aren’t well-defined, they might pose serious risks to your business. These include security breaches, non-compliance with regulations, and data quality issues. 

All of which may jeopardize trust and business continuity

 How to Strengthen Data Governance During Migration?

  • Establish and convey clear data governance policies and protocols to ensure consistency and compliance.
  • Encrypt sensitive data during the migration process itself to protect against unauthorized access.
  • Regularly conduct audits of data access and usage to maintain compliance.

Data may be mishandled during migration without proper governance, leading to unauthorized access, loss, or corruption. To prevent these risks and maintain your data’s trustworthiness, confidentiality and accuracy during migration, you must establish strong data governance policies

Data Migration Challenge #5: Unorganized Data Structure

Unorganized data in the source system poses numerous challenges during migration. 

The lack of structure and consistency can lead to confusion among data handlers. That makes it difficult to accurately identify, extract and transfer relevant data. 

Consequently, data may be transferred incompletely or with inaccuracies, potentially leading to duplicate records, data loss or corruption in your new system. 

 How to Handle Unorganized Data Before Migration?

  • Conduct data cleansing and restructuring before migration to remove duplicates and standardized formats.
  • Develop a data migration plan with clearly defined data mapping rules to ensure accuracy.
  • Use data profiling tools to identify and rectify data quality issues before migration.

The absence of a coherent data organization might result in duplicate entries, data mismatches, and data mapping errors. By taking these systematic steps, you can rest assured that your data transitions seamlessly to your new system.

Data Migration Challenge #6: Lacking Data Protection Measures

Insufficient data protection measures during migration create vulnerabilities that compromise the security of sensitive information.

It’s similar to moving your valuable documents to a new space without locking them in secure boxes. If anyone accesses them during the move, you risk theft, leaks or even tampering with your data. 

In the same way, hackers, malware, and insider threats can exploit weak security, leading to data theft, financial loss and manipulation of your data.

The absence of encryption, access controls, and data masking further heightens the risk. To prevent these risks, you must implement robust data protection strategies throughout your migration process.

How to Ensure Data Protection During Migration?

  • Use strong encryption for data in transit and at rest to prevent unauthorized access.
  • Implement strict access controls and authentication measures to limit data access to authorized users.
  • Continuously monitor and audit the migration process for security vulnerabilities and suspicious activities.

By prioritizing data security, you can ensure a safe, compliant, and risk-free migration, protecting your valuable data assets. 

Data Migration Challenge #7: Bringing Data Into the System

Did you even try fitting a square peg into a round hole? That’s what happens when your data from one system does not align with the structure of a new system.

Integrating data into the target system becomes complex and challenging when your target system has different data structures, storage mechanisms, or database technologies than the source system. 

Without proper planning for this disparity, you may face issues, such as incorrect data mapping, validation errors, and data type conversion issues. 

How to Overcome Data Integration Challenges During Migration?

  • Use data integration middleware to bridge the gap between systems.
  • Validate data compatibility and perform necessary transformations.
  • Conduct data reconciliation to ensure all data is successfully integrated.

By addressing system and format differences, you can ensure a successful data integration without compromising the quality, functionality or reliability of your data.

Data Migration Challenge #8: Lack of Collaboration Among Teams

To be honest, data migration is not just an IT task. It requires input from your business stakeholders, end-users and technical teams. 

When these groups fail to communicate, misunderstandings may arise about data requirements, priorities and expectations. 

The result? A big blow to your data migration process. 

For instance, your IT teams may not fully understand the specific business needs, leading to inadequate data mapping and transformation. Conversely, business stakeholders and end-users may not comprehend the technical constraints, resulting in unrealistic expectations. 

This lack of coordination can lead to delays, data quality issues, and unsatisfactory outcomes, hindering your migration’s overall efficiency and success. 

How to Improve Collaboration Among Teams For Successful Migration? 

  • Establish clear communication channels among all involved team members.
  • Create a dedicated migration team with representatives from different departments to ensure diverse inputs.
  • Regularly update stakeholders on the migration progress and address concerns promptly to keep everyone aligned. 

Thus you can avoid costly mistakes and streamline your migration process by fostering effective teamwork and open communication.

Data Migration Challenge #9: No Integration Of Processes

When data migration is considered a separate task, without considering how it fits with day-to-day operations, it can result in significant issues. The challenges could include:

  • Data inconsistency
  • Redundancies 
  • Workflow disruptions

None of which would benefit your business.  

Plus, inadequate data validation and testing can result in inaccurate or incomplete data, making it difficult for your teams to make informed business decisions.

How Can You Ensure That Your Migration Aligns With Other Business Processes? 

  • Match your data migration objectives with overall business goals to avoid disruptions.
  • Test the migrated data against specific business scenarios to validate its integrity.
  • Ensure seamless integration of data migration with existing workflows.

Thus, you must strategically align your processes and business needs with data migration to avoid workflow disruptions, costly setbacks and better decision-making. 

Data Migration Challenge #10: Finding an Expert Data Migration Service Provider

Selecting an appropriate data migration service provider is vital for a smooth and successful migration process.

What if midway through the migration process, you realize that some records are missing, others are duplicates, or some of your data is corrupt?

Your team will be stuck fixing errors (and waste their time) instead of focusing on what needs more attention. This is what happens when you choose the wrong provider. 

Simply put, the wrong choice can lead to various issues and challenges. 

  • Under-experienced providers may lack the expertise to handle complex data structures, resulting in data loss or corruption during migration. 
  • Insufficient planning and coordination may lead to project delays and increased costs
  • Security and compliance may be compromised if the provider lacks robust data protection measures. 

How to Choose the Right Data Migration Provider?

Picking the right provider is crucial to avoid these risks and ensure a seamless and stress-free data migration experience.

  • Industry-specific Experience: Look for a provider with proven experience in data migration projects similar to yours.
  • Security Measures: Make sure that they follow strict data protection protocols, including encryption and compliance with industry best practices. 
  • Migration Plan: A reliable provider should offer you a clear migration strategy, risk assessment and contingency plans.
  • Proven Track Record: Check if they’ve successfully handled large amounts of data and complex migrations. 
  • Customer Reviews: Check for customer satisfaction reviews and ratings for a reliable migration process. 

So, if you want to avoid costly errors, reduce risks and want a secure data migration experience, select a reliable and skilled provider

Are You Ready to Migrate Your Data?

And that’s it! With our entire discussion, one thing is clear you cannot take data migration lightly. 

A single misstep can result in data loss, security risks, unexpected downtime, etc. 

Therefore, you also need the right partner for such a critical organizational change. (And you don’t want any novice to handle that!)

That’s where Augmented Systems comes in!

Our vetted experts have successfully handled several migration projects across industries. We know exactly what works and what doesn’t.

Now, the decision is in your hands, whether you want to risk your valuable data or want a smooth migration. 

Having said that, if you want any help with your migration project, we’re here to help

Happy Migration!

Data Migration Challenges: FAQs

1. What is data migration?

Data migration is the process of moving your data from one source, location, or format to another. You can transfer your data to a new system, platform, database or cloud environment. 

2. What are the four R’s of migration?

The four R’s of migration are:

  • Rehost
  • Refactor
  • Rearchitecture
  • Rebuild

Each of the above factors represents a different approach to moving your applications and data to a new environment.

3. How important is data migration?

Data migration is important as it allows you to upgrade your systems, improve your business performance and ensure the integrity of your data. 

A well-executed data migration helps prevent data loss, downtime, and security breaches, thus ensuring a seamless migration. 

4. What are the five advantages of data migration?

The most important benefits of data migration are:

  • Improved performance
  • Better data security
  • Cost savings
  • Scalability
  • Data Accuracy
Categories
Blog Data Visualization

Revealed: Best Data Visualization Tools for 2023

If you’ve clicked on this blog, you find yourself in a situation where you have an important dataset to analyze but are unsure which data visualization tools to use.

Fortunately, your search ends here.

In this blog post, we’ll provide a thorough understanding of data visualization tools, why they are important, and how you can find the best one that suits your requirements. We’ve selected some of the cutting-edge data visualization tools to help you discover different insights and patterns within your data.

We’ll also dig into the advantages and drawbacks of each tool so that you have all the details you need to select the best companion for your team’s particular requirements.

Let’s get started.

What is Data visualization, and Why Is It Important?

The term “data visualization” describes the visual depiction of data and information using tools like maps, charts, graphs, and other visual aids. Data visualization helps make complex and big datasets understandable and accessible so that patterns, trends, and insights may be quickly found and understood. 

By translating raw data into visual formats, data visualization improves communication, analysis, and decision-making across various areas- from business and science to journalism and academia.

Importance of Data Visualization

Data visualization provides a quick and effective approach to presenting information by using images and graphics that everyone can understand. It highlights patterns and insights that can’t be detected through raw data analysis.

For example, through a data visualization tool of sales data, it becomes evident that the sales of a certain product spikes during the weekends.

An exceptional visualization communicates a story by removing irrelevant aspects and emphasizing the crucial ones.

Let’s understand how data visualization can be crucial in different areas.

1. Data Visualization in Business Analytics

Business analytics is the investigation of business information to assist firms in making sensible choices. Data visualization is important because it displays the most recent trends and patterns. 

For example, when reviewing sales data, tools like Tableau or Google Charts allow the company to rapidly determine whether sales are increasing or decreasing.

2. Data Visualization in Business Intelligence

In business intelligence, data visualization facilitates more informed strategic decisions. 

For example, if a company aims to boost sales by 15% in a year. By utilizing data visualization, they can monitor sales trends, pinpoint successful products, address underperforming items, and craft targeted marketing strategies for enhanced outcomes.

3. Data Visualization in Big Data Analytics

Dealing with big data analytics can be intimidating due to the volume of data. Data visualization can help comprehend this information by highlighting hidden connections and structures that go unnoticed.

For instance, when facing a dataset with millions of rows, data visualization tools provide a straightforward way to unearth patterns that would be hard to spot otherwise.

4. Data Visualization in IoT

The Internet of Things (IoT) is like a big network of things connected to the Internet. This can be anything from smartwatches to industrial machinery.

Data visualization is important in IoT because it helps make sense of the data these devices create. 

For example, it can aid in detecting faults with these devices early, allowing the company to address them before they cause major problems.

5. Data Visualization in Data Science

Data science is like solving puzzles with big sets of information. Data visualization turns data into pictures and graphs, helping data scientists see important trends and connections. This helps them make smarter decisions that lead to new ideas and discoveries.

For instance, if a scientist is studying a disease and wants to know which genes are linked, they can use data visualization tools to group similar genes and figure out more about them.

After understanding what data visualization is, the question that might leave you scratching your head is: Who will invest countless hours plotting dots on the scatter chart? That’s precisely where data visualization tools come into play.

What are Data Visualization tools?

Data visualization tools are software that helps users craft visual displays of data and information. They enable the presentation of intricate data in a manner that makes it easy to understand and interpret.

The primary goal of these tools is to simplify data interpretation and facilitate the extraction of valuable insights from it. Each tool has unique features, but at its core, it lets you enter data and change its appearance using graphics.

Augmented Systems data visualization tool is a game-changer for businesses seeking to gain deeper insights from their data.

Though not all, many of these tools also provide ready-made templates for crafting basic visual representations.

Let’s delve deeper into our selection of the best 9 data visualization tools. This will bring you one step closer to converting complex data into visually captivating and effortlessly understandable insights.

9 Best Data Visualization Tools Of 2023

Let’s have a look at some of the best data visualization tools.

Disclaimer: The prices, reviews, and ratings are taken from the respective companies’ websites as of the date of publishing this blog. These things are subject to change and we request you to please refer to the respective websites for the latest pricing.

1. Power BI

Microsoft’s Power BI, a user-friendly application for data visualization, provides a variety of options for showing data on local computers and in the cloud. It functions with numerous robust databases like Teradata, Salesforce, and SQL Server

Additionally, it integrates with well-known programs like Excel, a creative toolset for data. This technology aids organizations in producing eye-catching images and offers immediate insights that accelerate decision-making processes.

In a nutshell, Power BI is a powerful data assistant that makes complex information simple to comprehend and use.

Pros of Power BI

  • Doesn’t need special tech support
  • Fits smoothly with current apps
  • Makes custom dashboards
  • Offers strong security
  • No worries about speed or memory
  • Compatible with Microsoft products

Cons of Power BI

  • Can’t handle many different datasets.

Pricing

Power BI Pro:

  • Cost: $13.70 per user per month
  • Suitable for regular users

Power BI Premium:

  • Cost: $27.50 per user per month
  • Offers more advanced features
  • Good for intensive use

“Per Capacity” Plans:

  • Tailored for large organizationsCustom pricing based on needs

Customer ratings

  • G2- 4.4/5 (1000 reviews)
  • Capterra – 4.6/5 (1466 reviews)

2. Tableau

Tableau is a well-known data visualization and analysis platform suited to large corporations’ needs. Its powerful data handling features make it ideal for processing and understanding large amounts of data, allowing enterprises to get insights. 

Interactive visuals can be readily created and shared using numerous visualization techniques it offers. If you’re seeking a robust analytics tool for massive data and advanced visuals, Tableau is a top choice.

Pros of Tableau

  • Excellent visualizing abilities
  • Interface that is simple to use
  • Capabilities for high performance
  • Allows access to many data sources.
  • Mobile device responsiveness
  • A helpful and informative user community

Cons Of Tableau

  • Pricing is on the expensive side.
  • There are no auto-refresh or report scheduling options.

Pricing

There exists a free edition known as Tableau Public. A payment of $70 per user per month is required for access to more advanced functionalities.

Customer Ratings

  • G2- 4.4/5 (1836 reviews)
  • Capterra – 4.5/5 (2,100+ reviews)

3. Infogram

Infogram stands out as a prominent web-based tool for crafting engaging infographics and data visuals. It caters to all users, enabling easy creation of interactive reports, dashboards, and captivating data-driven infographics. 

With a range of features, including 550+ maps, 35+ charts, 20 templates, images, icons, and a drag-and-drop editor, it suits beginners and experts alike. Users can customize colors, styles, logos, and display options. 

The extensive library encompasses a million icons, GIFs, and photos. Interactive charts facilitate linking for audience engagement. The tool also enables the creation of interactive and shareable reports, complete with performance metrics to evaluate audience interaction.

Pros of Infogram

  • Grabs the reader’s attention with visually appealing content.
  • Offers diverse output options: charts, infographics, one-pagers, and reports.
  • User-friendly interface suitable for all skill levels.
  • Access to a wide range of assets: maps, charts, templates, icons, images, and GIFs.
  • Customizable elements: colors, styles, logos, etc.
  • Facilitates shareable content creation with built-in metrics for tracking engagement.

Cons of Infogram

  • Some believe that Infogram is not suitable for enterprise-level companies.
  • Number of licenses available for the enterprise version is limited. 
  • Users may struggle with integrating custom fonts and databases.

Pricing

  • Basic: $0/month for 10 projects
  • Pro: $19/month for 100 projects
  • Business: $67/month for 1,000 projects
  • Team: $149/month for 3,000 projects

Customer Ratings

  • G2- 4.7/5 (178 reviews)
  • Capterra – 4.5/5 (71 reviews)

4. Plecto

Plecto is a comprehensive business dashboard solution for businesses of all sizes. It enables users to create tailored dashboards by combining data from multiple sources and systems. 

The combination of data visualization, gamification, and data management technologies streamlines KPI monitoring, team engagement, and employee guidance on a single platform. Plecto’s custom dashboards provide real-time data visualization, allowing users to easily and precisely manage company objectives and outcomes. 

Individuals can create personalized dashboards using user-friendly dashboard widgets and a drag-and-drop interface. 

Pros of Plecto

  • With the Plecto app for iOS and Android, you can visualize real-time performance data on any screen and follow progress.
  • Gamification components such as contests, leaderboards, and achievements can be used to motivate teams and create engagement.
  • Consolidate data from several sources into a single dashboard widget to display informative KPIs.
  • Data from many sources, such as integrations (Salesforce, Podio, Pipedrive, Zendesk, and so on), spreadsheets (Excel), databases (SQL), and human entries, are shown.

Cons of Plecto

  • Not affordable for small-sized enterprises.

Pricing

  • Medium- $200 per month for the first 10 licenses – yearly payment.
  • Large -$350 per month for the first 10 licenses – yearly payment.

Customer Ratings

  • G2- 4.1/5 (34 reviews)
  • Capterra – 4.5/5 (31 reviews)

5. Qlik

Qlik Sense features an AI-powered data analysis engine, letting you mirror how the human mind processes information. Irrespective of data sources or dataset size, Qlik Sense effortlessly manages it all. 

It simplifies data import, visualization, and analysis with interactive charts. All charts and visuals are update in real time, ensuring you always have the latest, precise information. You can then transform this data into relevant insights, storing them in the cloud for access from various devices.

Pros of Qlik

  • Utilizes AI machine learning for data analysis.
  • Charts update automatically based on data context.
  • Seamless integration with various data sources.

Cons of Qlik

  • Steeper learning curve.
  • Smaller enterprises might find it relatively expensive.

Pricing

  • Free trial available before upgrading.
  • The paid version costs $30 per user per month.
  • Enterprise plan details require direct contact with sales.

Customer Rating

  • G2- 4.5/5 (653 reviews)
  • Capterra – 4.4/5 (242 reviews)

6. Google Data Studio

Google Data Studio offers an easy-to-use entry point for newcomers in data visualization. With easy login using Google credentials, it quickly enables access to its platform. While it offers a more limited template selection, the tool remains valuable for analyzing client metrics and business trends. 

It effortlessly connects with external data sources, simplifying data extraction and transformation. Even for those without extensive experience, its built-in features empower the conversion of raw data into meaningful visualizations. The collaborative aspect, similar to other Google tools, promotes real-time teamwork. 

Pros of Google Data Studio

  • Beginner-friendly interface.
  • Operates on a cloud-based platform.
  • Facilitates real-time collaboration on data reports.

Cons of Google Data Studio

  • Not suitable for handling intricate data visualizations.
  • Limited capability in sourcing data from external origins.

Pricing

  • It’s free for everybody.

Customer ratings

  • G2- 4.6/5 (11 reviews)
  • Capterra – 4.5/5 (298 reviews)

7. Plotly

Plotly serves as an analytical powerhouse, allowing you to swiftly create charts, presentations, and dashboards using basic spreadsheets. You can leverage its capabilities with JavaScript, Python, R, MATLAB, Jupyter, or Excel. 

Through its web-based charting tool, you can rapidly craft visually appealing graphics catering to personal use or collaborative efforts.

Pros of Plotly

  • There are numerous options for importing data.
  • Solutions may be implemented in several ways.
  • The tool is simple to use.
  • It makes collaboration and teamwork easy.

Cons of Plotly

  • Speed can be a concern at times
  • The free version has several limitations.
  • Multiple screen flashings can cause confusion and distraction.

Pricing

  • Student plan: $59 per user per year.
  • Personal plan: $396 per user per year.

Customer ratings

  • G2- 4.8/5 (34 reviews)
  • Capterra – 4.8/5 (8 reviews)

8. Domo

Domo is a business intelligence tool designed for companies dealing with complex or extensive datasets. Major organizations such as eBay, ESPN, Cisco, and Emerson are among Domo’s users.

Pros of Domo

  • Offers a wide array of report and chart templates.
  • Features a natural language query capability to answer basic data questions.
  • Can analyze data from over 1,000 sources.
  • Provides alert functionality for reaching set goals.

Cons of Domo

  • Not suitable for beginners.

Pricing

  • Domo’s pricing is tailored to each organization’s needs. To get a quote, it’s best to contact the sales department.

Customer ratings

  • G2- 4.4/5 (702 reviews)
  • Capterra – 4.3/5 (279 reviews)

9. Zoho Analytics

Zoho Analytics is a valuable data visualization tool specifically useful for marketing and sales professionals. It’s a dual-purpose software, serving as a business intelligence and data analytics solution with a strong emphasis on data security.

It empowers you to fetch data from various sources and swiftly craft multidimensional visualizations. In a short span, you can create customized dashboards featuring interactive tables, charts, and more tailored to your company’s requirements.

By incorporating enhanced analytics, Zoho Analytics provides automatic insights without manual analysis. 

Pros of Zoho Analytics

  • User-friendly drag-and-drop interface.
  • High level of customization is available.
  • AI-based assistant

Cons of Zoho Analytics

  • Data viz experience is required to use this tool effectively.

Pricing

Personal Use:

  • Free to use

Enterprise Plans

  • Starts at $24 per month.

Customer ratings

  • G2- 4.2/5 (284reviews)
  • Capterra – 4.4/5 (280 reviews)

After learning about the 9 best data visualization tools, let’s proceed and understand how to pick the best one for your specific needs.

How to Choose the Best Data Visualization Tool?

Selecting the ideal visualization tool involves making challenging decisions to discover the most suitable match for your requirements. No single data visualization service universally serves all users or situations. 

Let us guide you through these trade-offs, helping you pinpoint the data visualization tool that best aligns with your goals, skills, and resources.

1. Flexibility

Unless you’re after a very specific and limited solution, the flexibility of your data visualization tool is a crucial factor. To make the most of your data, it should cover many functions, starting with getting the data ready so that you can create useful and meaningful visuals.

Having advanced and predictive analytics helps you get the most from your data and anticipate the future. This way, you can make smart choices for your company.

Moreover, a versatile tool is also suitable for all types of users, no matter their level or job. For instance, while some use it to analyze data, create charts, and other ways to show data, others might only edit or view these visuals.

2. Proposal Models

There are two primary models for data visualization software proposals: the All-Inclusive model, which includes all functionalities in the subscription, and the Custom-Made model, which offers extra paid options.

The first model ensures clear transparency: You know precisely what you’re paying for, avoiding surprises. In contrast, Custom-Made options grant initial flexibility but can become costly with added features.

3. Deployment Expenses

It’s crucial to accurately estimate the expenses when embarking on a significant project, like implementing a data visualization solution. This makes pricing one of the most critical factors. 

The pricing should fit well with your company’s size, needs, and available resources. As previously mentioned, the proposal should be transparent, giving access to essential features without restrictions and with a clear cost.

For larger organizations, choosing a solution that works well on a big scale is important, as more users might lead to higher costs. Hence, they should plan for a well-thought-out proposal that suits their company’s needs. 

4. Data Handling Capability

This element is essential because data visualization tools are designed to speed up and make data processing simpler. Therefore, picking a solution that functions effectively under heavy data loads is crucial while avoiding speed and efficiency issues.

Assess how productively the tool can manage a variety of data sources. It should connect to numerous databases and import various file types without problems. Additionally, it should be simple to see various data sets in a unified manner through a single dashboard.

5. Mobile Compatability

For the best results, your data visualization platform should be easy for everyone to use and accessible at all times. This means it should work well on different devices.

Choosing a solution with a responsive design or a mobile web app is a good idea. This lets you easily create a mobile app so users can check information on their tablets or smartphones whenever they want.

6. Support

Setting up a data visualization platform can be technical, as can its daily usage. This underscores the importance of having your supplier available to provide assistance and support. They can help you address any challenges that you may encounter.

Summary

Data visualization tools make complicated information simple and guide data-based choices. The correct tool gathers all your data sources in one place, ensuring vital information is easily accessible at your fingertips. 

From business analytics to big data processing, these tools serve as indispensable companions, enabling organizations to unlock valuable insights from their data. 

So, explore, experiment, and leverage the best data visualization tools available to turn data into insights, insights into actions, and actions into success.

Get in touch with our data visualization experts to present complex data in clear and intuitive visuals.

Categories
Application Integration Blog

What Is Application Integration and How to Master It?

Are you a business or part of a team that utilizes multiple software applications?

You might use Salesforce for sales and HubSpot for marketing. And of course, let’s not forget using Slack for everyday team communication.

Managing these software applications every day can sometimes be frustrating. It can lead to a wastage of precious time and a reduction in your productivity.

This is where application integration comes in as a business process. It ensures that your software applications work together for maximum productivity.

In this blog, we will take a closer look at its benefits and how you can use it for your business.

Let’s get started and take a closer look at what application integration is all about.

What Is Application Integration?

what is application integration diagram


In the simplest terms, application integration is the process of connecting separate software applications. This helps them share data with each other to improve work efficiency.

You can think of it like building data bridges between various islands. Each application is an island connected by these bridges. This helps a free flow of information and better overall integration.

When these apps are integrated, your workload is significantly reduced. Data you enter automatically gets transferred between your apps. This reduces the need for manual typing and copy-pasting.

By applying best practices in application integration, you can eliminate repetitive daily tasks. It helps you focus on the work that actually requires your attention and time.

Real-Life Application Integration Examples

The incredible benefits and uses of application integration are not new. They were integrated into popular systems years ago. 

Here are some common application integration examples to help you understand:

  • E-commerce Order Processing 

In online stores like Amazon or eBay, application integration is used for every order.

When you buy something online, here is what happens under the hood:

  • The payment system processes your credit card
  • The store’s inventory system deducts that item from its stock
  • The CRM updates your purchase history
  • The store’s shipping system creates a label
  • The company’s accounting system records your sale

This is a very basic example of how application integration automates an e-commerce site. Using its benefits, many manual tasks are done automatically.

The best part? All of this happens within mere seconds!

  • New Employee Onboarding 

When a recruit joins a company, multiple business systems need to be updated. This involves HR adding them to payroll, IT creating email access, and facilities assigning them a desk.

Moreover, apps like Slack also need to add them to company channels. 

Using something like Azure integration services, you can easily trigger all of these actions automatically. This can be done from a single HR entry of the employee!

  • Sales and Marketing Sync

Leads are a major revenue generator for most businesses. When a marketing form is filled out, it is important to notify sales of the new lead.

Using application integration, you can make this happen instantly. This lets sales immediately follow up on the lead. They can even set up automated responses to warm them up without any human intervention.

benefits of application integrationWhy Application Integration Matters?

Here are the best benefits of connecting your apps using application integration tools:

Benefit What It Means for Your Business
Better Productivity -Reduced time wastage on manual data entry.

-More focus on real work

Fewer Errors Eliminating typos from copying data between systems
Real-Time Info Everyone works with the same up-to-date information 
Happier Customers -Orders ship faster
-Questions get answered quicker,– Problems get solved sooner
Lower Costs Get more value from the software without adding headcount

Common Application Integration Challenges

Before you start using application integration in your own business, it is important to understand its potential drawbacks.

Here are the common application integration challenges you may face:

  • Legacy Systems

Old traditional software usually doesn’t support many application integration tools. This requires modernizing them, which may incur extra work and planning.

  • Inconsistent Data Formats

One system using a “DD/MM/YY” format can have issues integrating with another that uses a “MM/DD/YYY” data format. It is important to align these formats with a single option before you start the integration.

  • Security Concerns 

Every connection you add can pose a security risk if not handled properly. It is important that you handle your data carefully.

One way to ensure this is to check who has access and permissions for each connection.

  • Growing Complexity 

When you connect many systems together, complications can arise. You must have the right strategy to reduce such issues.

Conclusion: Develop Your Own Application Integration Architecture

As we have seen through this blog, application integration is a powerful glue that connects different systems. It can automate your workflows and save your teams from manual busywork.

My favorite part about this method is that it does not require AI to achieve this task. This prevents a third-party AI agent from accessing your confidential company data.

The question that now remains is whether you are ready to implement it in your own organization.

To ensure it’s done properly, consider taking help from the experts at Augmented Systems.

For many years, Augmented Systems has earned its reputation as an industry leader in software consultancy for market giants. Their team specializes in using application integration to make your everyday tasks more efficient and easier.

You can consult with them to automate your workflows and design custom integration architectures for your needs.

Ready to make your data work seamlessly with every app? Contact the team at Augmented Systems and receive a free consultation on your next steps.

FAQs

1. What is application integration in plain English?

Application integration simply means making your different software apps talk to each other. For example, when someone fills out a form on your website, integration can automatically add them to your email list and sales system. No manual typing needed. Your apps just work together.

2. Can you give me a real-life application integration example?

Sure! Imagine a customer buys something on your online store. Application integration automatically charges their card, removes that item from your inventory, adds the sale to your accounting software, and sends a shipping request to your warehouse. This is done all at once, without anyone lifting a finger.

3. What tools do I need to connect my apps?

Application integration tools are software that do the connecting work for you. If you’re a small business, try simple tools like Zapier. For bigger companies, options like MuleSoft or Workato offer more power. These tools come with ready-made connectors, so you don’t have to be a tech expert to use them.

4. What makes application integration hard to do?

The biggest application integration challenges usually involve legacy systems that don’t play nice with new software, apps that store data in different formats, and keeping everything secure as you add more connections. It can get messy fast without a good plan.

5. How do I integrate apps the right way?

Follow these application integration best practices: Start with just one process instead of trying to connect everything at once. Pick tools with pre-built connectors to save time. Keep security front and center. And once it’s working, keep an eye on it so you catch problems early.