Data and its importance are increasing in this digital world!
You collect all this data, but what’s next?
You’ll need structured insights from that data, and that’s what's more important for your business.
Business intelligence tools like Microsoft Power BI allow you to do it with data visualization.
So, you or a decision maker from your business can take strategic actions by seeing that data.
Several other data visualization tools are available on the market, but the reason we are talking about Power BI is because of its unique advantages, like:
- Brings all your scattered data into one unified view
- Offers real-time analytics
- It scales with your business
In this blog, we’ll discuss the top 7 Power BI benefits and why you should use it to give meaning to your business data.
Reasons to Use Microsoft Power BI: Table Of Contents
- What is Microsoft Power BI?
- What Should You Use Microsoft Power BI?
- How Augmented Systems can give meaning to your data?
- Reasons to Use Microsoft Power BI: FAQs
What is Microsoft Power BI?
Microsoft Power BI is a business intelligence tool that interprets your collected data, cleans it and represents it in a graphical form, or in a dashboard.
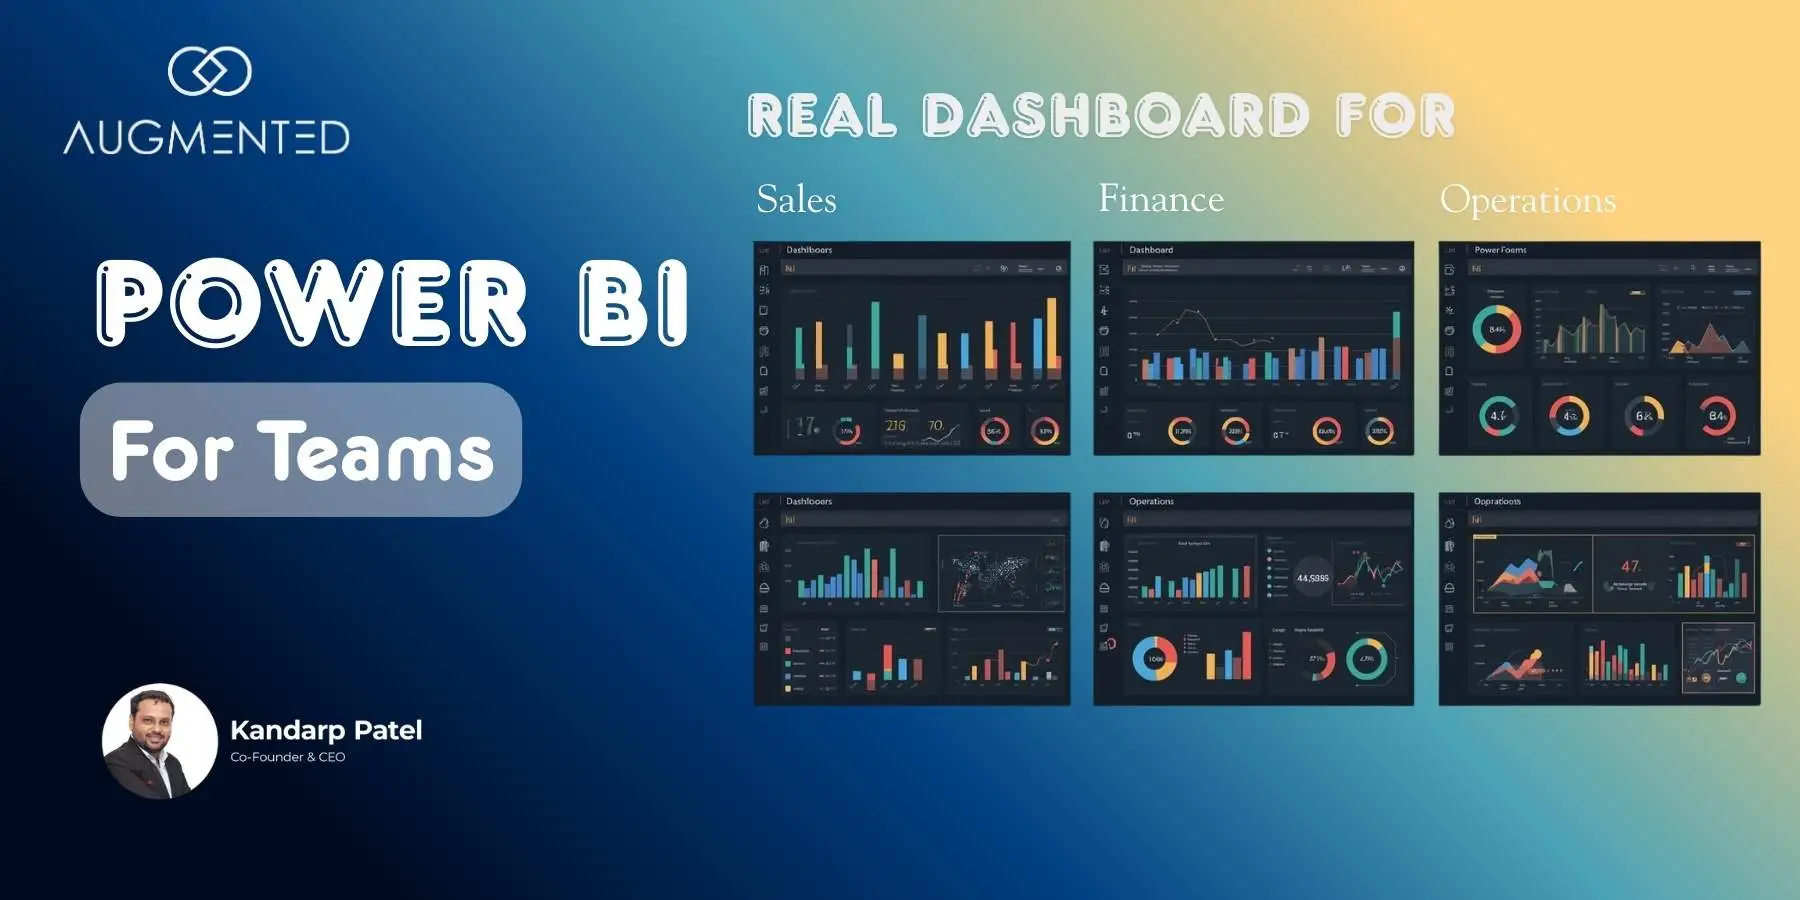
Through Microsoft Power BI, you can connect it to the various data sources you have, and combine them in a dashboard to create data-rich visuals that include:
- Area charts
- Funnel charts
- Bar and column charts
- Decomposition tree
- Gauge charts
- Pie charts
- Combo charts
- Doughnut charts
All these visuals can help you uncover crucial insights or reveal what you were missing from the data.
What Should You Use Microsoft Power BI?
There are several Power BI Benefits that you can experience once you start using it. Let me walk you through them.
1. Integration With The Microsoft Ecosystem
This is one of the biggest Power BI advantages!
It can integrate with all the Microsoft software services which probably your business is already using, like:
- Excel
- SharePoint
- Teams
- Azure SQL
- Dynamics 365
Let me explain!
It can extract all the real-time sales data from the Dynamic 356 sales and visualize it immediately.
These visual reports can also be shared directly in Teams channels or SharePoint pages, making internal communication easier.
So, basically, if your organization is already using Microsoft tools, your team members will be familiar with the interfaces, Excel formulas and the drag-and-drop features.
As a result, you won’t have to invest much time and effort in training your employees, and they can quickly build reports.
This ease of integration is why using Power BI over other data visualization tools makes sense to businesses.
2. Quick Implementation With Prebuilt Dashboard
You can begin fast with Power BI!
And that makes it popular among startups and big organizations.
This data visualization tool is highly user-friendly, and you can build clear dashboards and reports within a few days, that too without much technical knowledge.
Plus, you’ll get pre-built dashboards for Salesforce, Google Analytics, Excel, and Microsoft Dynamics 365.
Do you get that? You don’t have to build everything from scratch.
Plus, with the free Power BI Desktop, you can easily create reports and dashboards to present your data visually. Also, there’s the mobile app for Power BI, which you can use to view dashboards instantly, anytime and anywhere.
3. Advanced Data Connectivity And Real-Time Dashboards
The business world of current times is competitive and fast-moving, and so, you cannot afford to lose time in getting reports and insights.
You need it in real time!
Power BI can easily do this by connecting all your scattered business data and bringing it into a single view in real-time.
It can extract data from 70+ connectors with just one click, some of which can be Salesforce, Google Analytics, AWS, Excel or APIs.
So, the real goal is not only collecting data but also gaining real-time insights from it.
For instance, if you are running a retail chain, you can use Power BI to track real-time data on sales, inventory, finances and more.
You can combine all this data in a dashboard to get an overall picture of the business's operations and performance.
Pro Tip: You can use Power BI dataflows to automate data preparation and unify data models across departments.
4. Artificial Intelligence (AI) Capabilities
AI isn’t the future! It’s the present.
It is everywhere!
Power BI also has built-in AI capabilities like:
- Key Influencers: Presents the exact factors that are bringing outcomes.
- Smart Narratives: Creates a summary of the charts and dashboards.
- Decomposition Tree: Breaks down the data in a step-by-step form.
Another plus point of Power BI is that it can be connected directly with Azure Machine Learning and Cognitive Services.
Through this, you can:
- Predict sales or user engagement trends
- Analyze customer sentiments
- Detect data patterns in real time
One thing I really like about Power BI is its Q&A feature, where you can ask any question and instantly get an answer in a graph or chart format.
5. Scalability
When your company grows, your team size and data sets also expand!
So, to manage and extract data from those huge datasets, Power BI has a solution.
You can get Power BI Premium, a paid tool. I would say it is worth your investment because:
- You’ll get dedicated cloud resources for handling large datasets
- Its semantic scale-out model splits the work across multiple servers
- Multiple users will be able to access the dashboard without affecting the loading time
- It uses gateway clusters to ensure that both cloud and on-premises data refreshes quickly
Plus, there are features like large data models and paginated reports, which are specifically for enterprise needs.
6. Data Security
With so much data in your directory, you need to handle it securely.
And security is something that you won’t have to worry about in Power BI.
It uses Microsoft Entra ID (formerly Azure Active Directory) for:
- Secure sign-in
- Single Sign-On
- Multi-Factor Authentication
That’s not all!
You can add sensitivity labels to reports or dashboards to manage access and protect them.
And again, you can benefit from the Microsoft ecosystem by integrating it with Microsoft Defender. This will help you monitor abnormal activities, such as if anyone tries to download it from an unknown location or device.
It also supports row-level and object-level security, which allows other users to see the specific data you want them to view.
7. Cost-Effective
Irrespective of what level you operate your business, every dollar counts!
Power BI offers data visualization services to businesses of all levels and has flexible licensing options for them:
Power BI Desktop
This is a free version, and if you are new to Power BI and want to try it to better understand it, you can go for this. Here, you can build reports, transform data, and run visual analytics, but you cannot share them with others.
Best For: Data analysts, small business or startup owners, and anyone exploring Power BI for the first time.
Power BI Pro
This is the plan you should pick if you want to share the reports, collaborate with internal and external teams, and publish reports on Power BI Service.
Best For: Small or mid-sized companies and teams that need collaboration and report sharing.
Power BI Premium
If you run a large enterprise or handle huge datasets, you can upgrade to the Premium plan. It offers dedicated cloud capacity up to 400 GB per dataset and advanced AI features.
Best For: Large enterprises that need scalability and dedicated cloud capacity.
Augmented Systems Can Give Meaning To Your Data!
Microsoft Power BI is that bridge that fills the gap between your data and strategic action or decision.
Even though it is user-friendly, you may still need expert guidance to bring the most out of your data.
And that’s where the data visualization services of Augmented Systems come in!
We have a team of experienced data visualization consultants who know how to use Power BI smartly and transform complex data into clear, intuitive visuals.
Over the last few years, we have been building custom dashboards for our clients that have helped them:
- Reduce data analysis time by 55%
- Increase overall productivity by 68%
So, contact our data visualization consultants and see what’s possible when business intelligence meets real strategy.
7 Reasons to Use Microsoft Power BI: FAQs
1. What are the benefits of using Microsoft Power BI?
These are the top benefits of using Microsoft Power BI:
- Easy Integration with the Microsoft ecosystem
- Quick Implementation
- Scalability
- Advanced Data connectivity
- AI Capabilities
- Data security
- Cost Effectiveness
2. What is the main purpose of Power BI?
The main purpose of using Power BI is to:
- Bring out understandable insights from the raw data.
- Make decisions faster and smarter without using any complex tools or codes.
3. What is one reason to use the Power BI desktop?
One particular reason for using Power BI Desktop would be the free and easy data connection. You can process and clean the data to create visual dashboards in one place, and that too at no cost.
4. What is the best feature of Power BI?
The best feature of Power BI is its real-time dashboards. Using them, you can see the current data and track performance instantly, be it sales, operations, or marketing. Thus, you always remain updated and take strategic actions.

